


Ethereum has held near $2,667 after pulling back from the $2,800 region, while ETF inflows and exchange withdrawals continue as traders assess whether the recent breakout can survive.
- Ethereum trades near $2,667 after retreating from $2,800, while seven-day gains remain firmly positive overall.
- U.S. spot Ethereum ETFs attracted $66.01 million, extending their net inflow streak to five sessions.
- $2,540 remains the key breakout support as analysts assess whether Ethereum can retest $3,000 next.
- Binance stablecoin netflows rose sharply while Ethereum exchange netflows turned negative during the latest pullback.
- BBP remains positive near 124.67, while Ethereum stays above its $2,557 Bollinger Band midpoint.
CoinGecko data show ETH closed around $2,687 on September 24 after reaching $2,775 on September 21. At the time of writing, Ethereum traded at $2,666.63, down 0.78% over 24 hours but up 7.90% over seven days, with a market capitalization near $326.3 billion.
The pullback followed a steep recovery from below $2,400 earlier in September. ETH approached $2,800 before sellers stopped the advance, bringing the former breakout area around 2,530–2,540 back into focus.
Why is Ethereum price struggling below $2,800?
Ethereum’s first problem sits around the recent high. The $2,530–$2,540 region previously acted as resistance and could now serve as support after the breakout. Analyst Wealthmanager placed a potential retest near $2,539, while the larger upside projection near $3,391 remains conditional on ETH holding support and clearing several resistance levels.
The supplied daily chart gives buyers some technical support. ETH remains above the 20-day Bollinger Band midpoint at $2,557.52. The upper band stands near $2,781.85, close to the region where the latest rally stalled, while the lower band sits around $2,333.18.
Bull Bear Power remains positive at approximately +124.67. Buyers therefore retain an advantage on that indicator, although the latest positive bars have contracted from their recent highs. Momentum has cooled as ETH moved away from the upper Bollinger Band.
As crypto.news reported in its Ethereum $2,800 rejection analysis, ETH remained above its longer 4-hour moving averages even after falling below $2,700. The 100-period moving average stood near $2,540.49, almost directly inside the breakout support zone now being watched.
That analysis placed the 4-hour 200-period moving average near $2,499.93. A deeper decline through the 2,530–2,540 region would therefore bring the $2,500 area into view before the much lower Bollinger support around $2,333.
Can ETF inflows keep the Ethereum breakout intact?
U.S. spot Ethereum ETFs have continued attracting money even as ETH retreated from its recent high. SoSoValue data showed $66.1 million in net inflows on September 24, extending the streak to five consecutive trading sessions.
BlackRock’s ETHA led the session with $26.8 million, followed by Fidelity’s FETH with $21.5 million. Grayscale’s Ethereum Mini Trust drew another $17.8 million. No U.S. spot Ether ETF recorded a net outflow during the session.
Across the five-session run, the funds accumulated $746.5 million. The sequence included $270 million on September 21, $162.2 million on September 22, $104.5 million on September 23 and $66.1 million the following session.
The declining daily inflow totals show that ETF demand has remained positive while slowing from the strongest session. Fund flows measure subscriptions into regulated products and do not establish whether ETH will hold any particular technical level.
Ethereum’s rejection near $2,800 occurred while institutional ETF demand stayed positive. As crypto.news previously reported in its analysis of Ethereum ETF inflows during the $2,800 rejection, the September 21 and 22 sessions alone drew $432.2 million before ETH fell below $2,700.
Exchange flows show ETH leaving as stablecoins enter Binance
CryptoQuant contributor CryptoOnchain reported another pattern beneath the pullback. Ethereum exchange netflow moved from +138,174 ETH on September 18 to -138,247 ETH on September 23, meaning the observed flow changed from net deposits to net withdrawals as the price retreated from $2,775.35.
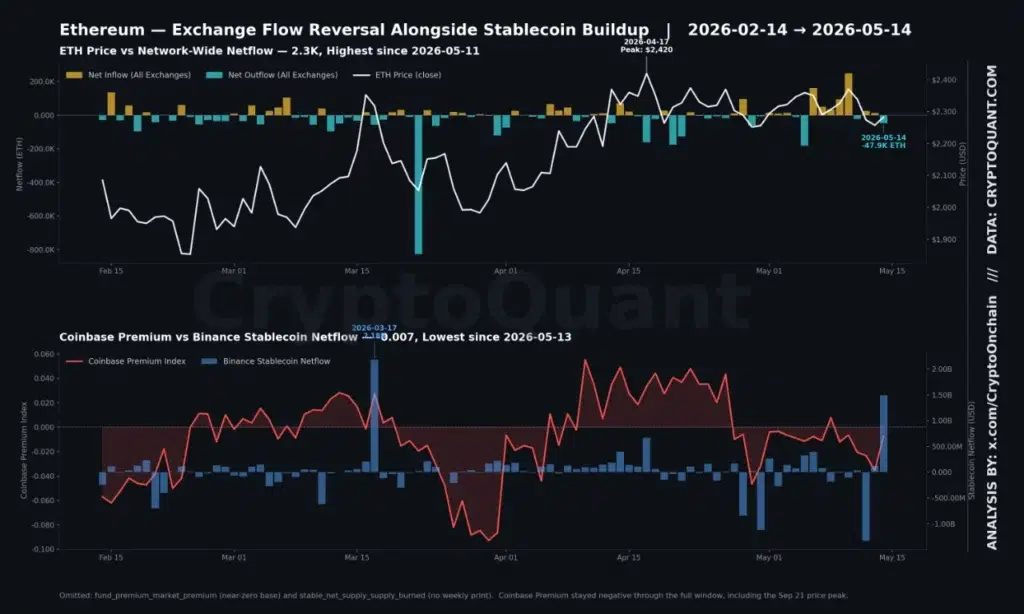
At the same time, CryptoOnchain reported that Binance stablecoin netflow averaged approximately $107.98 million per day during the week ending September 23, up 552% week over week. The analyst described one possible reading as capital positioning for re-entry, though that interpretation remains “unverified.”
A separate CryptoQuant post from the same analyst reported an average daily Binance USDT-on-Ethereum netflow of $80.8 million in the week ending September 21, the highest reading in its six-month comparison window. Binance’s total stablecoin reserve stood at $43.59 billion in that dataset.
CryptoOnchain’s September 23 dataset found that the Coinbase Premium Index remained negative, ranging from -0.01 to -0.09 during the observed period. Under that measure, U.S. Coinbase spot activity did not lead the move toward the September 21 high.
The staking rate moved in the opposite direction, rising from 35.30% to 35.71% during the same period, according to the analyst. Staking changes occur more slowly than daily price action, so the rise does not establish a direct cause for ETH’s latest rebound.
Will Ethereum reach $3,000 before a deeper correction?
The immediate upside test remains 2,781–2,800. The upper Bollinger Band sits around $2,781.85, while recent spot trading failed to sustain a move through the same region. Regaining it would leave $3,000 as the next large psychological level identified across several analyst setups.
RektProof’s scenario projects that ETH “could” approach $3,000 before rotating lower toward equal lows around $2,300. The analyst places heavier resistance between $3,000 and $3,200. Such a path remains a forecast, not a confirmed price target.
Wealthmanager’s chart uses a more aggressive conditional target near $3,391 if ETH successfully holds $2,540 and clears $2,800 and $3,000. IncomeSharks has separately mapped a deeper liquidity sweep toward 2,100–2,200 before a potential recovery toward 3,400–3,500. Neither path has been confirmed by current price action.
Leverage creates another risk around the support zone. Analyst Celal Kucuker warned that heavy long positioning “could” produce a liquidation-driven decline of approximately 20% if support fails and forced selling accelerates. The scenario would weaken if buyers defend support and ETH recovers.
More immediate liquidation data place the first pressure points much closer to the market. Crypto.news reported liquidation bands around $2,650 and $2,630 after ETH’s September 23 reversal, with another concentration around $2,700.
For the current chart, $2,557.52 remains the Bollinger midpoint, while the 2,530–2,540 region combines former breakout resistance with the 4-hour 100-period moving average. A recovery would first face 2,781–2,800 before the 3,000–3,200 resistance range identified by the analyst charts.
Disclosure: This article does not represent investment advice. The content and materials featured on this page are for educational purposes only.