
BNB price has dropped more than 16% from its recent peak near $720, while a giant megaphone pattern and a failed trendline retest raise the possibility of a deeper correction toward $500.
- BNB price has fallen more than 16% from its recent high near $720, with a giant daily megaphone pattern placing the $500 support zone in focus.
- A broken multi-year ascending trendline on the weekly chart has turned into resistance between $700 and $750 after a failed retest.
- Supertrend resistance near $673 and key support around $560 are likely to determine whether BNB recovers or revisits the lower boundary of the megaphone pattern.
According to data from crypto.news, BNB (BNB) price traded around $602 on June 9 after rebounding from a local low near $560 during last week’s crypto market liquidation event. The selloff coincided with nearly $1.8 billion in forced liquidations across the crypto derivatives market on June 2 and June 3, while Bitcoin briefly plunged toward $61,500 and dragged most large-cap altcoins lower.
The decline arrived during a period of weak risk appetite across digital assets. U.S. spot Bitcoin ETFs recorded consecutive outflow sessions ahead of key inflation data, while capital continued rotating into artificial intelligence-linked equities. Several major altcoins lost critical support levels as leveraged long positions were unwound across perpetual futures markets.
Meanwhile, Binance’s ecosystem continues to expand despite the recent volatility. The exchange recently launched the BNB Hack AI Trading Agent Edition initiative as it pushes deeper into AI-focused decentralized applications.
Growth in stablecoin activity and automated trading infrastructure on BNB Chain has helped support transaction demand even as token prices remain under pressure.
Weekly trendline breakdown puts long-term support at risk
The weekly chart shows BNB breaking below an ascending support trendline that had guided the uptrend since late 2023. After losing that level earlier this year, the token attempted to reclaim it during the recent rally toward $720 but failed to secure a breakout.
Former support has now turned into resistance near the $700-$750 region. Technical analysts often view failed retests of broken trendlines as confirmation that sellers have regained control of the higher-timeframe trend.
Momentum indicators also remain weak. Weekly RSI has fallen to around 40 and sits below its signal average, while MACD remains below the zero line despite a modest improvement in momentum during recent weeks. Those readings suggest buyers have yet to regain the strength that drove BNB’s advance throughout 2024 and much of 2025.
The weekly chart also highlights a major support area near $500. That zone has repeatedly attracted buyers over the past two years and now represents the most important level for bulls to defend if selling pressure returns.
Daily megaphone pattern points to $500 support zone
On the daily timeframe, BNB has formed a broadening pattern, commonly known as a megaphone. The structure consists of rising highs and declining lows, creating expanding price swings that often appear during periods of elevated volatility and uncertainty.
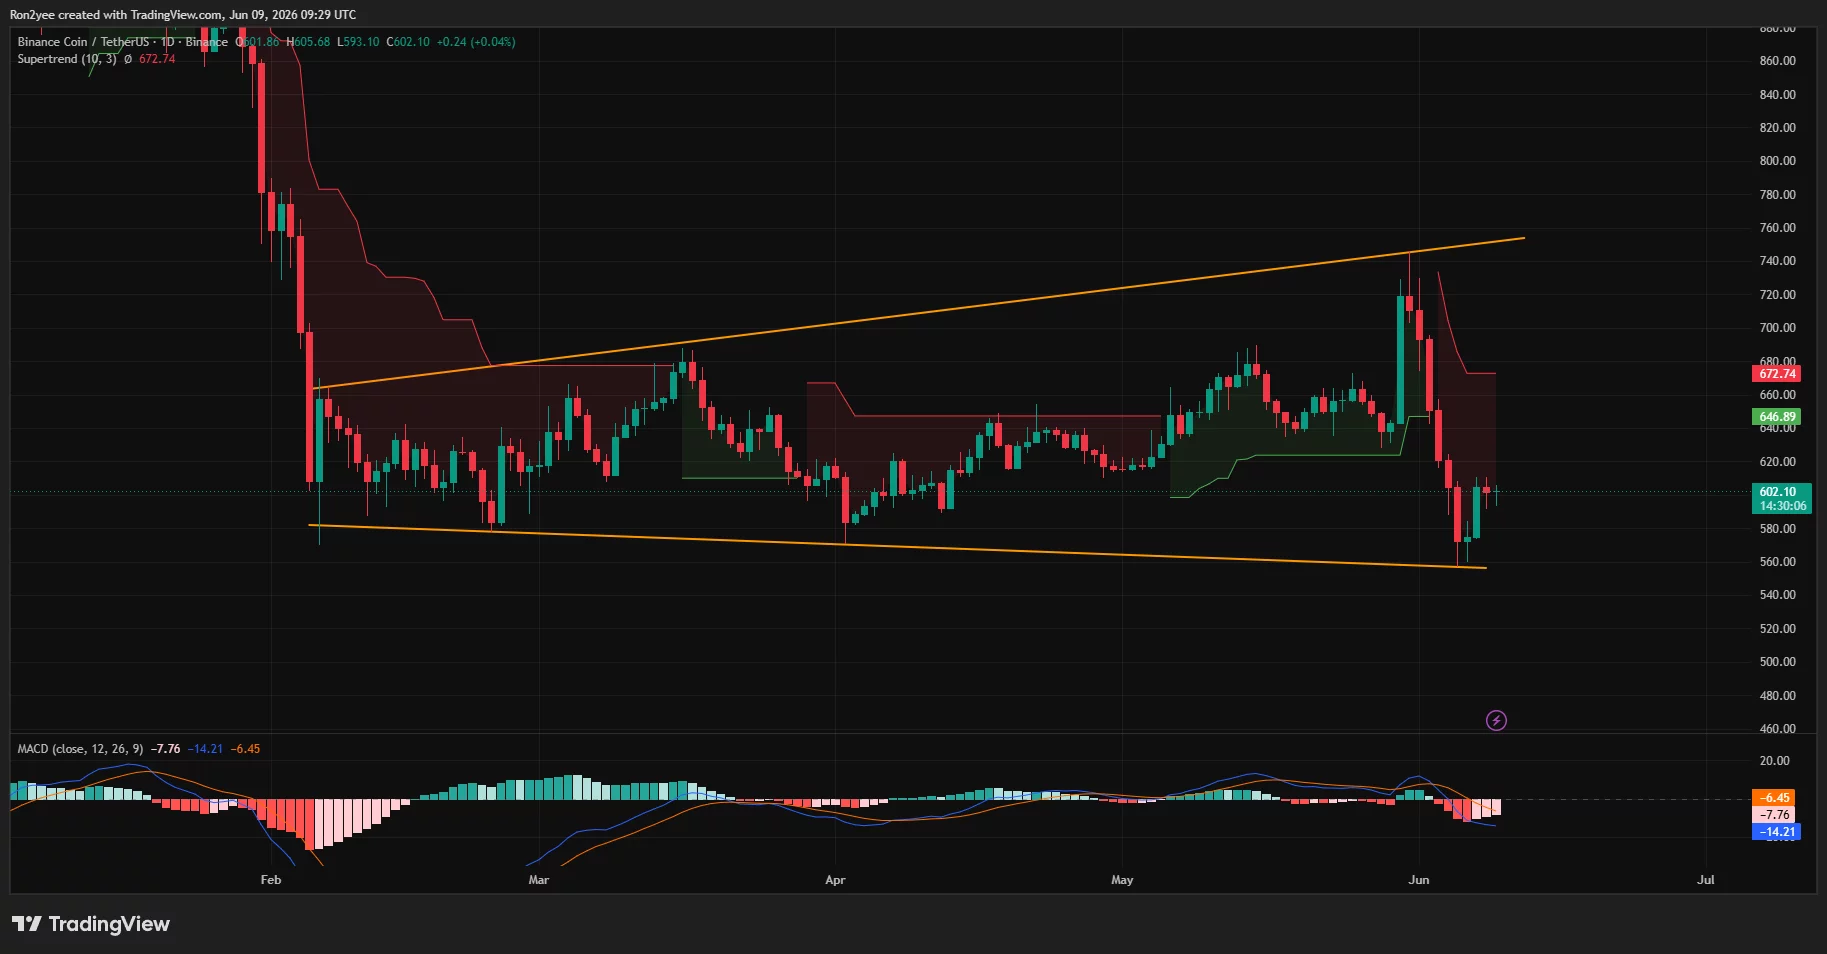
Recent price action produced another rejection near the upper boundary of the formation around $720 before BNB fell sharply toward the lower boundary near $560. Buyers stepped in at that support level, producing the current rebound.
Despite the bounce, the token remains below Supertrend resistance near $673. As long as BNB price stays beneath that level, rallies may continue to face selling pressure.
CoinGlass liquidation data suggests derivatives traders could play an important role in the next move. Much of the bullish leverage was flushed from the market during last week’s decline, but sizeable short liquidation clusters remain above current prices. A move back toward the $650-$680 region could force some bearish positions to close, adding fuel to a recovery attempt.
For now, traders are closely watching the battle between support near $560 and resistance around $673. A breakout above the Supertrend level could open the door for another test of the $720 region and the weekly trendline resistance overhead.
Another rejection, however, would place attention back on the lower boundary of the daily megaphone pattern and the major weekly support zone near $500, where the next decisive test for BNB may occur.
Disclosure: This article does not represent investment advice. The content and materials featured on this page are for educational purposes only.