Solana price has dropped more than 27% over the past month and nearly 74% from its 2025 peak, with fresh ETF outflows and a crypto market rout sending the token to a 52-week low.
- Solana price hit a 52-week low of $66.6, down 27% in a month and 74% from its 2025 high.
- Crypto liquidations topped $1.66 billion, with long positions accounting for $1.42 billion.
- U.S. spot Solana ETFs posted $12.7 million in outflows, their first net redemption day since May.
According to data from crypto.news, Solana (SOL) price traded near $68 on June 4 after briefly touching a 52-week low of $66.6. The token was down roughly 17% on the day, 27% over the past month, and nearly 74% from its 2025 high near $258, as a wave of liquidations and risk-off sentiment swept through the crypto market.
Solana’s price downtrend intensified as the cryptocurrency market suffered another sharp sell-off, with Bitcoin slipping toward the $66,000 level and triggering a cascade of liquidations across leveraged positions.
Derivatives markets absorbed much of the damage. CoinGlass data shows more than $1.66 billion was liquidated from the crypto derivatives market over the past 24 hours, including roughly $1.42 billion in long positions. The wipeout forced bullish traders to close positions at market prices, adding fresh downside pressure across major altcoins.
Solana price also fell as institutional sentiment for the token weakened this week. SoSoValue data shows that U.S. spot Solana ETFs recorded $12.7 million in net outflows on June 3, the first day of net redemptions since May. The withdrawal ended a period of steady inflows and arrived as investors reduced exposure to risk assets following the latest market downturn.
Outside crypto, geopolitical tensions in the Middle East continued to weigh on sentiment after renewed military activity increased demand for traditional safe-haven assets.
Rising oil prices and expectations that central banks could maintain restrictive policies for longer added another headwind for speculative markets.
Solana charts confirm a major technical breakdown
The weekly chart shows Solana breaking below the $76.6 support zone that had contained declines for several months. Sellers then pushed the token through the psychological $70 level before SOL price reached the $66.6 area, which now represents the most important near-term support on the chart.
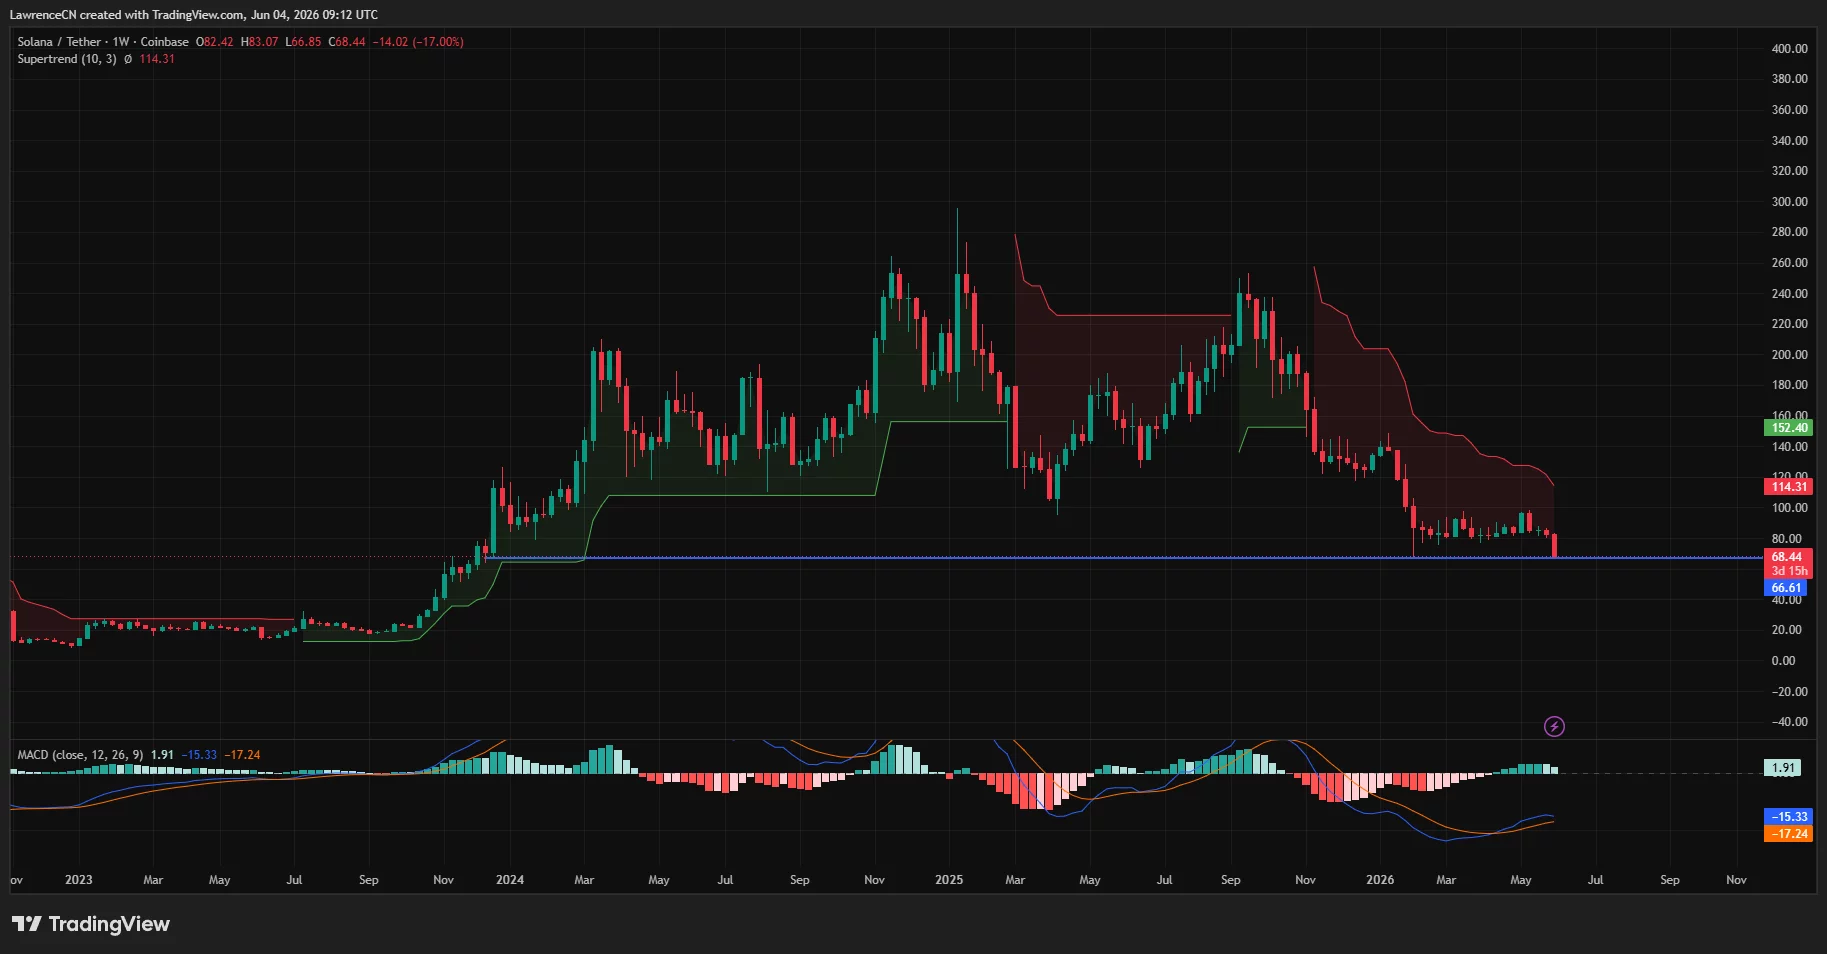
Technical indicators have deteriorated sharply. Solana remains below its Supertrend indicator, which currently sits near $114, leaving the long-term trend firmly bearish. Price also continues to trade well beneath major moving averages that had previously acted as support throughout 2025.
Momentum gauges offer little relief. The weekly MACD remains below the zero line, while both the MACD and signal lines continue to trend lower despite a slight reduction in bearish histogram strength. Until momentum indicators begin to reverse, sellers remain in control of the broader trend.
Looking at the liquidation data highlights where traders are focusing next. CoinGlass’ one-week liquidation heatmap shows a large concentration of leveraged positions clustered between $82 and $84. These levels could act as a magnet for price if a relief rally develops, although they also represent a significant resistance zone after the recent breakdown.
Commenting on the setup, analyst Jack Adams argued that Solana may not have reached its final low.
“I am almost certain $SOL is heading back to retest $67-$58 once more before reversing into $120-$175 this year.”
According to the analyst, previous monthly rejection zones suggest that the current decline is approaching an area where longer-term buyers could begin accumulating positions.
Downside risks remain elevated below key support levels
As of now, Solana price could see more downside ahead if the $66 support area fails to hold. A decisive breakdown would leave little historical support until the upper-$50 region, which coincides with the buy zone highlighted by several market technicians and roughly matches the measured move from the recent range breakdown.
At the same time, traders continue to monitor ETF flows and derivatives positioning for signs of stabilization. Continued fund outflows or another wave of long liquidations could accelerate downside momentum, particularly if Bitcoin extends its decline below nearby support levels.
Any meaningful recovery would likely require Solana to reclaim the former $76.6 support zone and force a move back toward the $82-$84 liquidity cluster. Until then, the technical structure remains bearish, with price trading at its lowest level in a year and sellers retaining control of the market.
Disclosure: This article does not represent investment advice. The content and materials featured on this page are for educational purposes only.