


Ethereum price fell 5% from $1,973 to $1,873 on July 28 after another rejection below $2,000 triggered forced selling and pushed ETH into a key technical support zone.
- Ethereum price dropped below $1,900 after buyers failed to break the $1,975–$2,000 resistance zone.
- Leveraged positions accelerated the decline as ETH moved through several long-liquidation clusters.
- ETH is testing the lower boundary of a rising wedge near $1,870 on the 4-hour chart.
- The next large concentration of downside liquidity sits around $1,840–$1,850.
Ethereum price falls below $1,900 after $2,000 rejection
According to data from crypto.news, Ethereum (ETH) price traded near $1,875 at the time of writing, down from an intraday high close to $1,973. The decline erased most of the gains from the previous session, when ETH reached its highest level since early June.
Selling intensified after buyers failed to push the price through the $1,975–$2,000 resistance range. The rejection trapped traders who had opened leveraged long positions in anticipation of a breakout above the psychological threshold.
ETH subsequently moved below $1,900, activating stop-loss orders and forcing position closures. The price reached approximately $1,873 before stabilizing around the lower end of the daily range.
Despite the decline, Ethereum remains above its early July low near $1,560. The token has gained roughly 20% from that level, meaning the wider recovery has weakened but has not yet been invalidated.
Leveraged longs accelerate the ETH sell-off
Derivatives positioning appears to have increased the speed of the decline. Bullish traders had built exposure as Ethereum approached $2,000, leaving the market vulnerable when spot demand failed to sustain the move.
The one-week ETH liquidation heatmap shows that the price passed through multiple areas of leveraged exposure between $1,950 and $1,890. Forced closures likely added sell orders as Ethereum broke through those levels.
The heatmap now shows a larger concentration of liquidity around $1,840–$1,850. Price can gravitate toward such areas because liquidations produce additional trading activity, although the data does not guarantee that ETH will reach the zone.
Transfers from large wallets to centralized exchanges may also have added to the pressure. Exchange deposits increase the amount of ETH available for sale, but they do not confirm that the holders have liquidated their assets.
Broader weakness across technology stocks contributed another source of pressure. Concerns about the financial returns from heavy artificial intelligence spending have increased volatility across global equities, encouraging investors to reduce exposure to risk assets, including cryptocurrencies.
ETH tests rising support near $1,870
Ethereum’s 4-hour chart shows the price testing the lower boundary of a rising wedge near $1,870. The trendline has supported the recovery since the middle of July, making the current area important for the token’s next move.
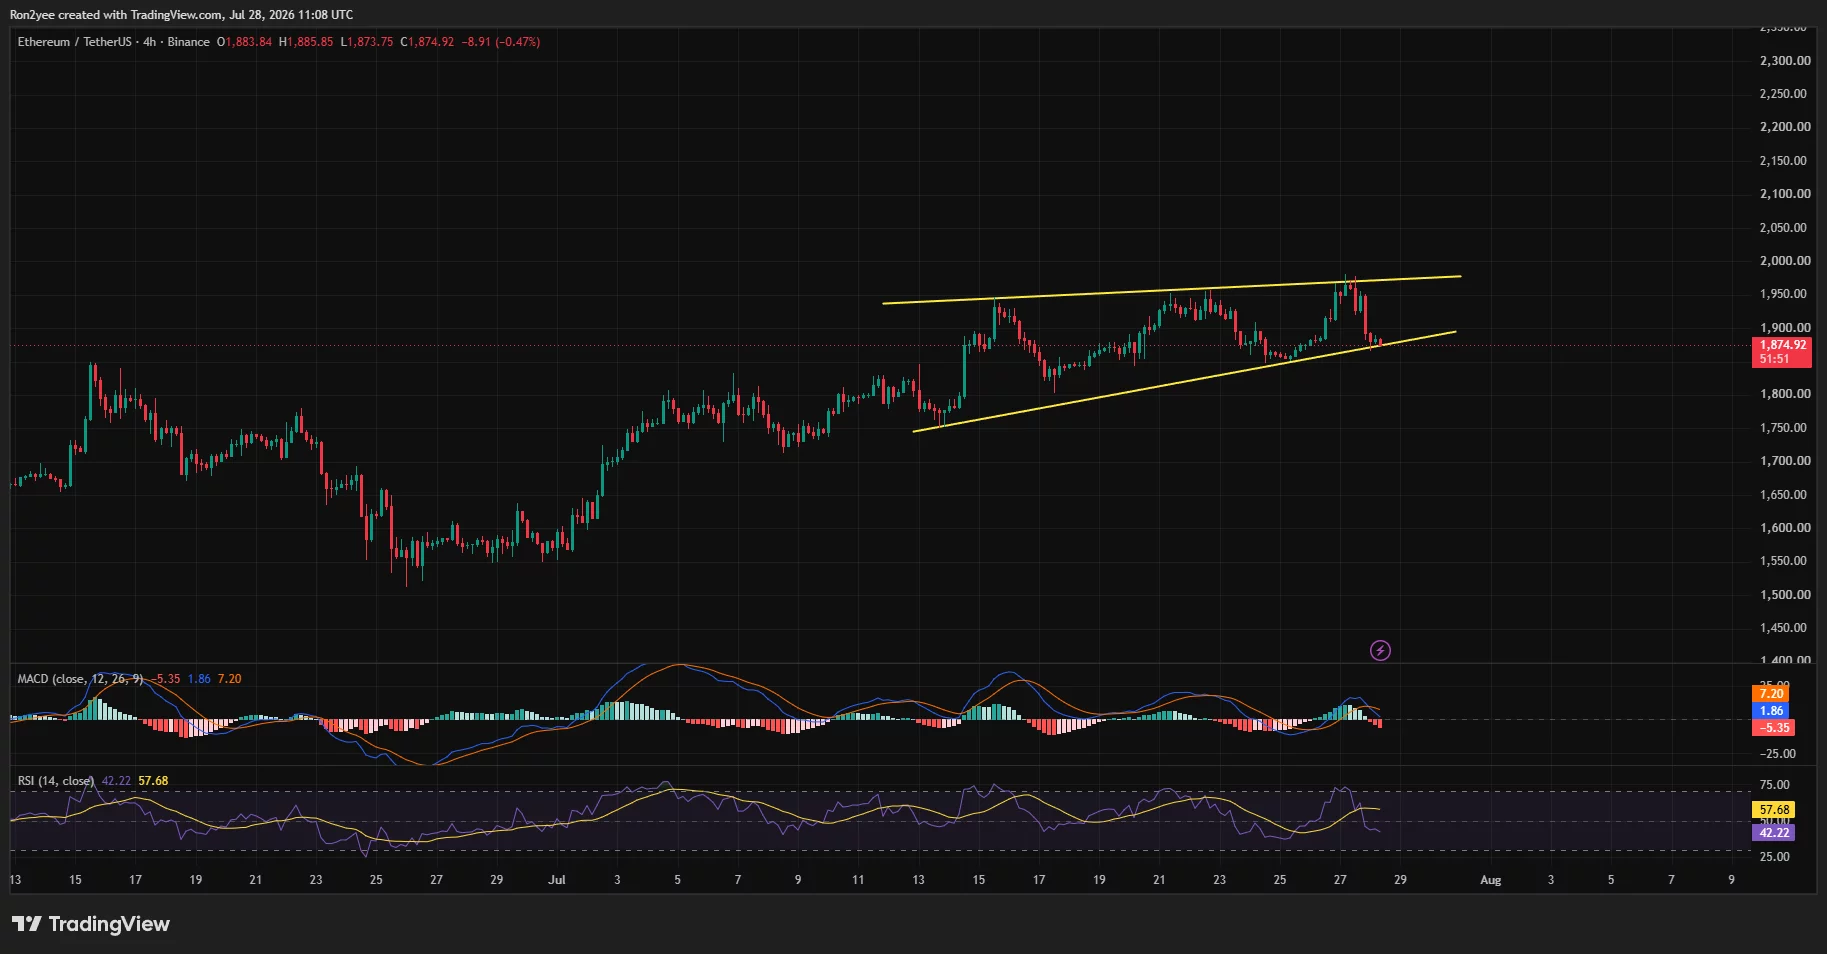
A decisive close below the trendline would weaken the rebound and could send ETH toward the $1,850–$1,840 liquidity zone. Failure to hold that area would expose the 100-day simple moving average near $1,758.
Momentum indicators support a cautious short-term outlook. The 4-hour relative strength index has fallen to 42.22, below its moving average of 57.68. The reading shows weakening demand but remains above the oversold threshold of 30.
The moving average convergence divergence indicator has also turned bearish. The MACD line has fallen below its signal line, while the histogram has moved into negative territory, showing that sellers retain short-term control.
On the daily chart, Ethereum price remains above its 20-day SMA, currently near $1,864, offering immediate support around the present price. The 50-day SMA stands lower at approximately $1,759.
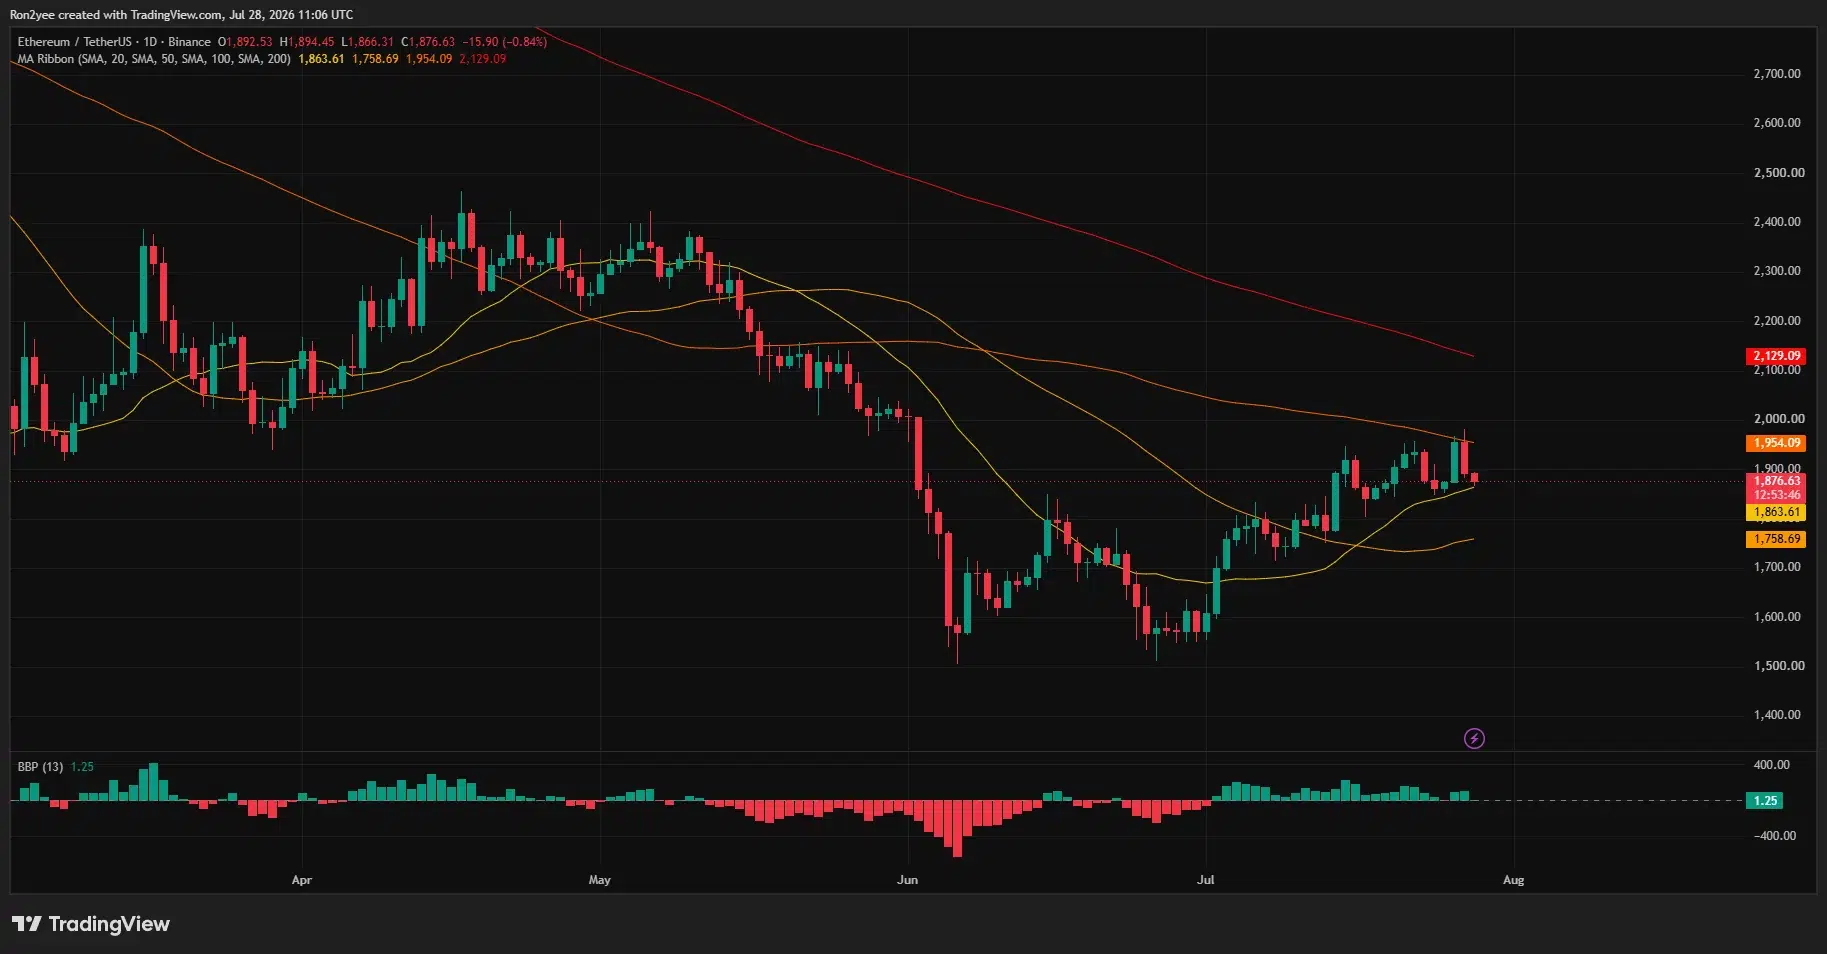
On the upside, ETH must first recover $1,900. Further resistance sits between $1,950 and $1,975, where the recent high and the 200-day SMA near $1,954 create a stronger supply zone.
A daily close above $1,975 would weaken the bearish setup and give buyers another chance to test $2,000. Until that happens, rebounds into the resistance zone may continue to attract selling.
Analysts identify $1,840 as the decisive support
Crypto analyst Ted Pillows described the current trading area as a key support zone for Ethereum.
“ETH is back into its key support zone. As long as this holds, Ethereum will continue to outperform Bitcoin.”
Pillows’ chart places support around $1,840, followed by possible recovery levels near $1,956, $2,030, and $2,195. A breakdown below the current zone, however, could shift attention toward approximately $1,700 and $1,530.
Market commentator Rain pointed to corporate accumulation as a potential source of longer-term demand. Rain noted that BitMine added nearly 10,000 ETH during the previous week, taking its reported holdings to approximately 5.79 million ETH.
Rain also said ETH had gained about 2.4% over the week while Bitcoin declined roughly 0.7%, pushing the ETH/BTC ratio to a three-month high. The relative strength suggests some investors continue to favor Ethereum despite the latest intraday correction.
Corporate buying may support ETH over longer periods, but it cannot prevent short-term volatility when leveraged positioning becomes crowded. The immediate outlook still depends on whether buyers can defend the $1,840–$1,870 region.
Fed expectations add pressure for US traders
US investors are also monitoring Treasury yields and expectations surrounding Federal Reserve policy. Higher risk-free yields can reduce demand for speculative assets and make Ethereum’s staking yield less attractive relative to government bonds.
Demand for US-listed spot Ethereum exchange-traded funds represents another key variable. Continued institutional inflows could help absorb exchange-based selling, while sustained outflows would remove a source of demand that supported the July recovery.
Regulatory uncertainty around staking services and liquid staking products remains relevant for US holders. Changes to the treatment or availability of those services could affect institutional demand and the way investors value Ethereum’s yield.
For now, $1,840 remains the principal downside level, while $1,950–$1,975 is the range bulls must reclaim. Holding support would preserve Ethereum’s July recovery structure, but a daily close beneath it could expose the 100-day SMA near $1,758.
Disclosure: This article does not represent investment advice. The content and materials featured on this page are for educational purposes only.