


Ethereum price rallied 5% to $1,966 on July 27 as surging spot demand, short liquidations, and tighter available supply pushed ETH toward the key $2,000 barrier.
- Ethereum price gained 5% to $1,966, while 24-hour spot trading volume jumped 118.53% to $9.21 billion.
- The daily chart places $1,981.50 and $2,000 as the next major resistance zones.
- 4-hour RSI reached 73.36, showing strong momentum but raising the risk of a short-term pullback.
- Liquidation data shows large leverage clusters near $1,980–$2,000, with downside liquidity around $1,930.
- Analysts see $2,350–$2,500 as possible targets if ETH establishes support above $2,000.
Ethereum price rally targets $2,000
According to data from crypto.news, Ethereum (ETH) price climbed to around $1,966 after trading near $1,870 during the previous session, extending a recovery that began from its June low near $1,512. The latest move brought ETH within 2% of the psychological $2,000 level.
Spot trading volume increased 118.53% over 24 hours to $9.21 billion, according to the supplied market data. Rising volume alongside price suggests buyers supported the advance rather than the move occurring during thin trading conditions.
The daily chart shows ETH reaching an intraday high of $1,981.24 before easing toward $1,964. That high closely matches the 100% Fibonacci retracement level at $1,981.50, making the $1,981–$2,000 area the first major test for the recovery.
Ethereum has already reclaimed the 78.6% Fibonacci level at $1,880.97. Below that price, the next retracement levels sit at $1,802.05, $1,746.62, and $1,691.19.
The daily Supertrend has also switched to bullish support at approximately $1,772.31. ETH would need to fall below that level before the broader recovery structure faces a more serious invalidation risk.
Spot demand and supply pressure support ETH
Ethereum’s rally coincided with a sharp increase in market activity and a reported rise in its staking rate to a record 34%. Staked tokens cannot immediately enter the spot market, reducing the liquid supply available to buyers during periods of stronger demand.
Higher Layer 2 throughput and decentralized finance activity have also increased smart contract execution. Under Ethereum Improvement Proposal 1559, part of each transaction’s base fee is burned, removing ETH from circulation when network usage rises.
These supply conditions do not guarantee further gains, but they can magnify price movements when demand accelerates. A smaller pool of liquid ETH means buyers may need to bid at progressively higher prices to complete large spot purchases.
US spot Ethereum exchange-traded funds provide another source of demand. The supplied market context indicates that the products recovered from volatile outflows earlier in July and began recording more consistent net inflows.
For US investors, sustained ETF inflows would offer evidence that regulated demand is strengthening alongside activity in native crypto markets. However, the upcoming Federal Reserve interest-rate decision remains a key risk because a hawkish policy signal could reduce demand for high-beta assets such as ETH.
Technical indicators warn of short-term overheating
Ethereum’s 4-hour chart shows the price moving inside an ascending parallel channel that has guided the recovery since early July. ETH recently rebounded from the channel’s lower boundary near $1,850 and returned to the $1,965 region.
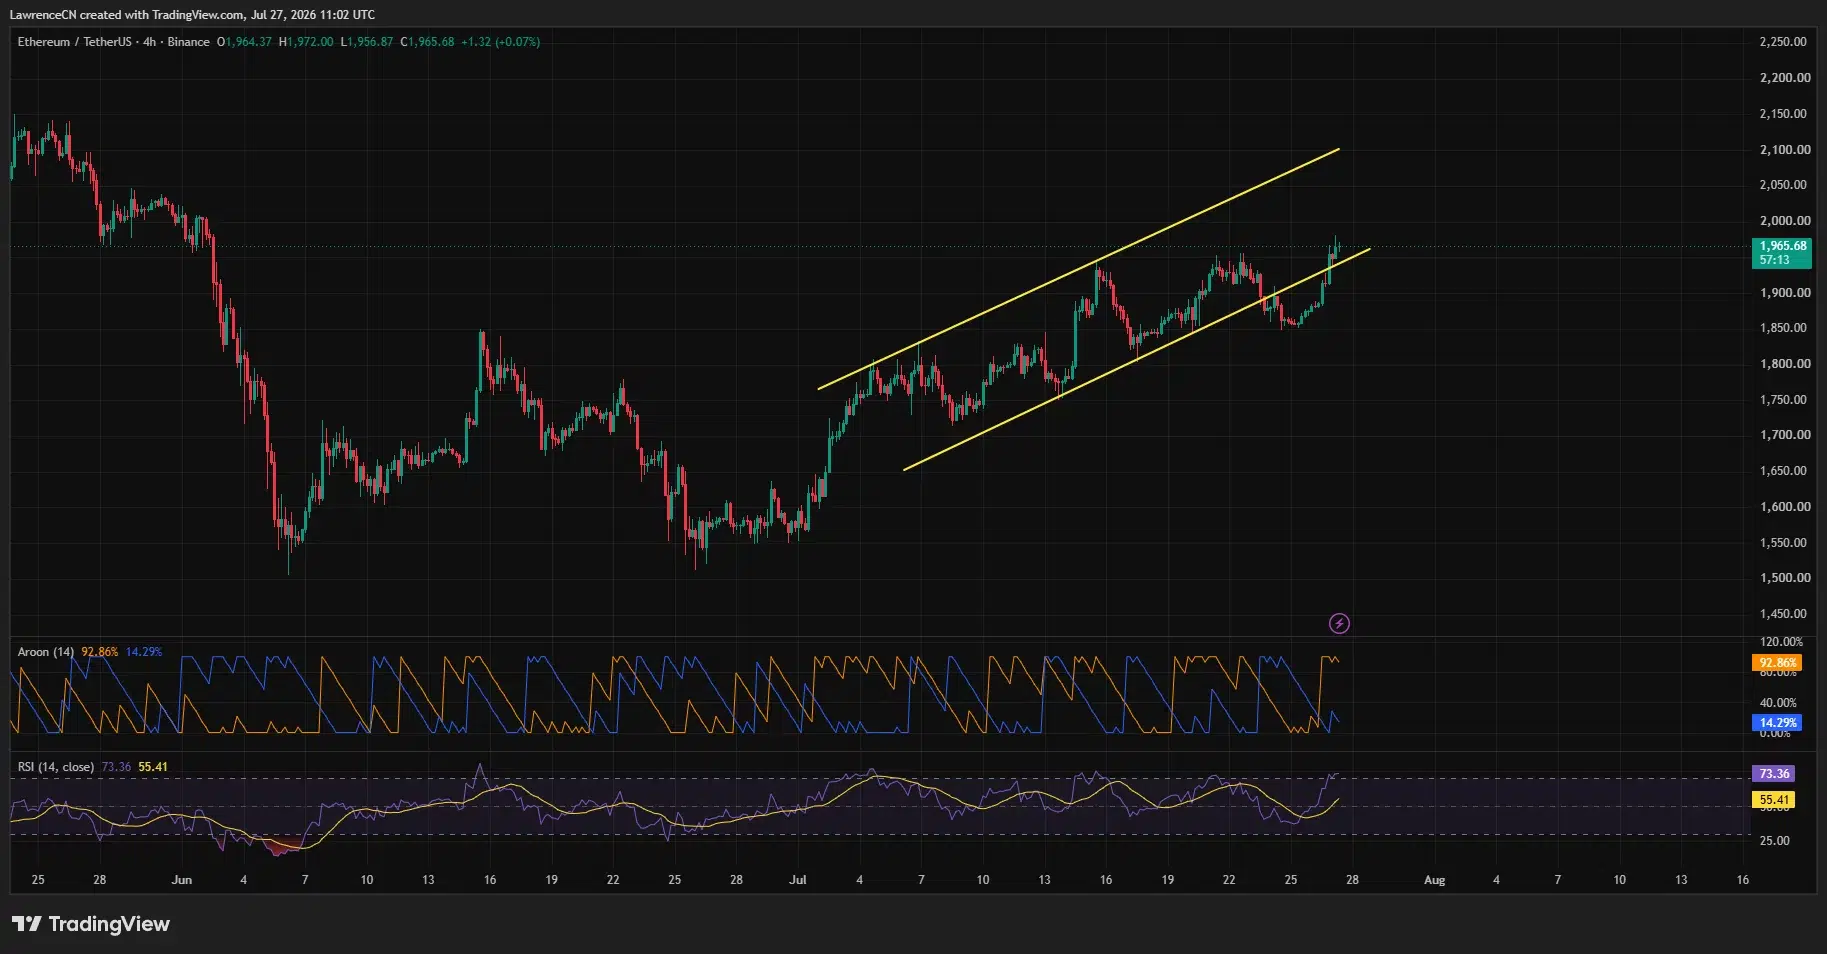
The Aroon Up indicator stands at 92.86%, compared with Aroon Down at 14.29%. That wide gap indicates that recent highs are arriving more frequently than recent lows, supporting the bullish short-term structure.
Momentum is becoming stretched, however. 4-hour relative strength index reached 73.36, above the conventional overbought threshold of 70 and well above its moving average at 55.41. This reading does not require an immediate reversal, but it raises the chance of consolidation or profit-taking near $2,000.
The daily moving average convergence divergence indicator remains constructive. Its MACD line sits at 46.51, above the 40.75 signal line, while the positive histogram reads 5.76. Those values show that upward momentum remains active despite ETH approaching resistance.
A daily close above $1,981.50 would clear the full Fibonacci recovery level shown on the chart. Bulls would then need to reclaim $2,000 as support before targeting the upper portion of the 4-hour channel near $2,050–$2,100.
Ethereum liquidations could accelerate the breakout
CoinGlass’s three-day liquidation heatmap shows concentrated leverage immediately above the current price. The strongest nearby clusters appear around $1,980–$2,000, with additional liquidity extending toward $2,040.
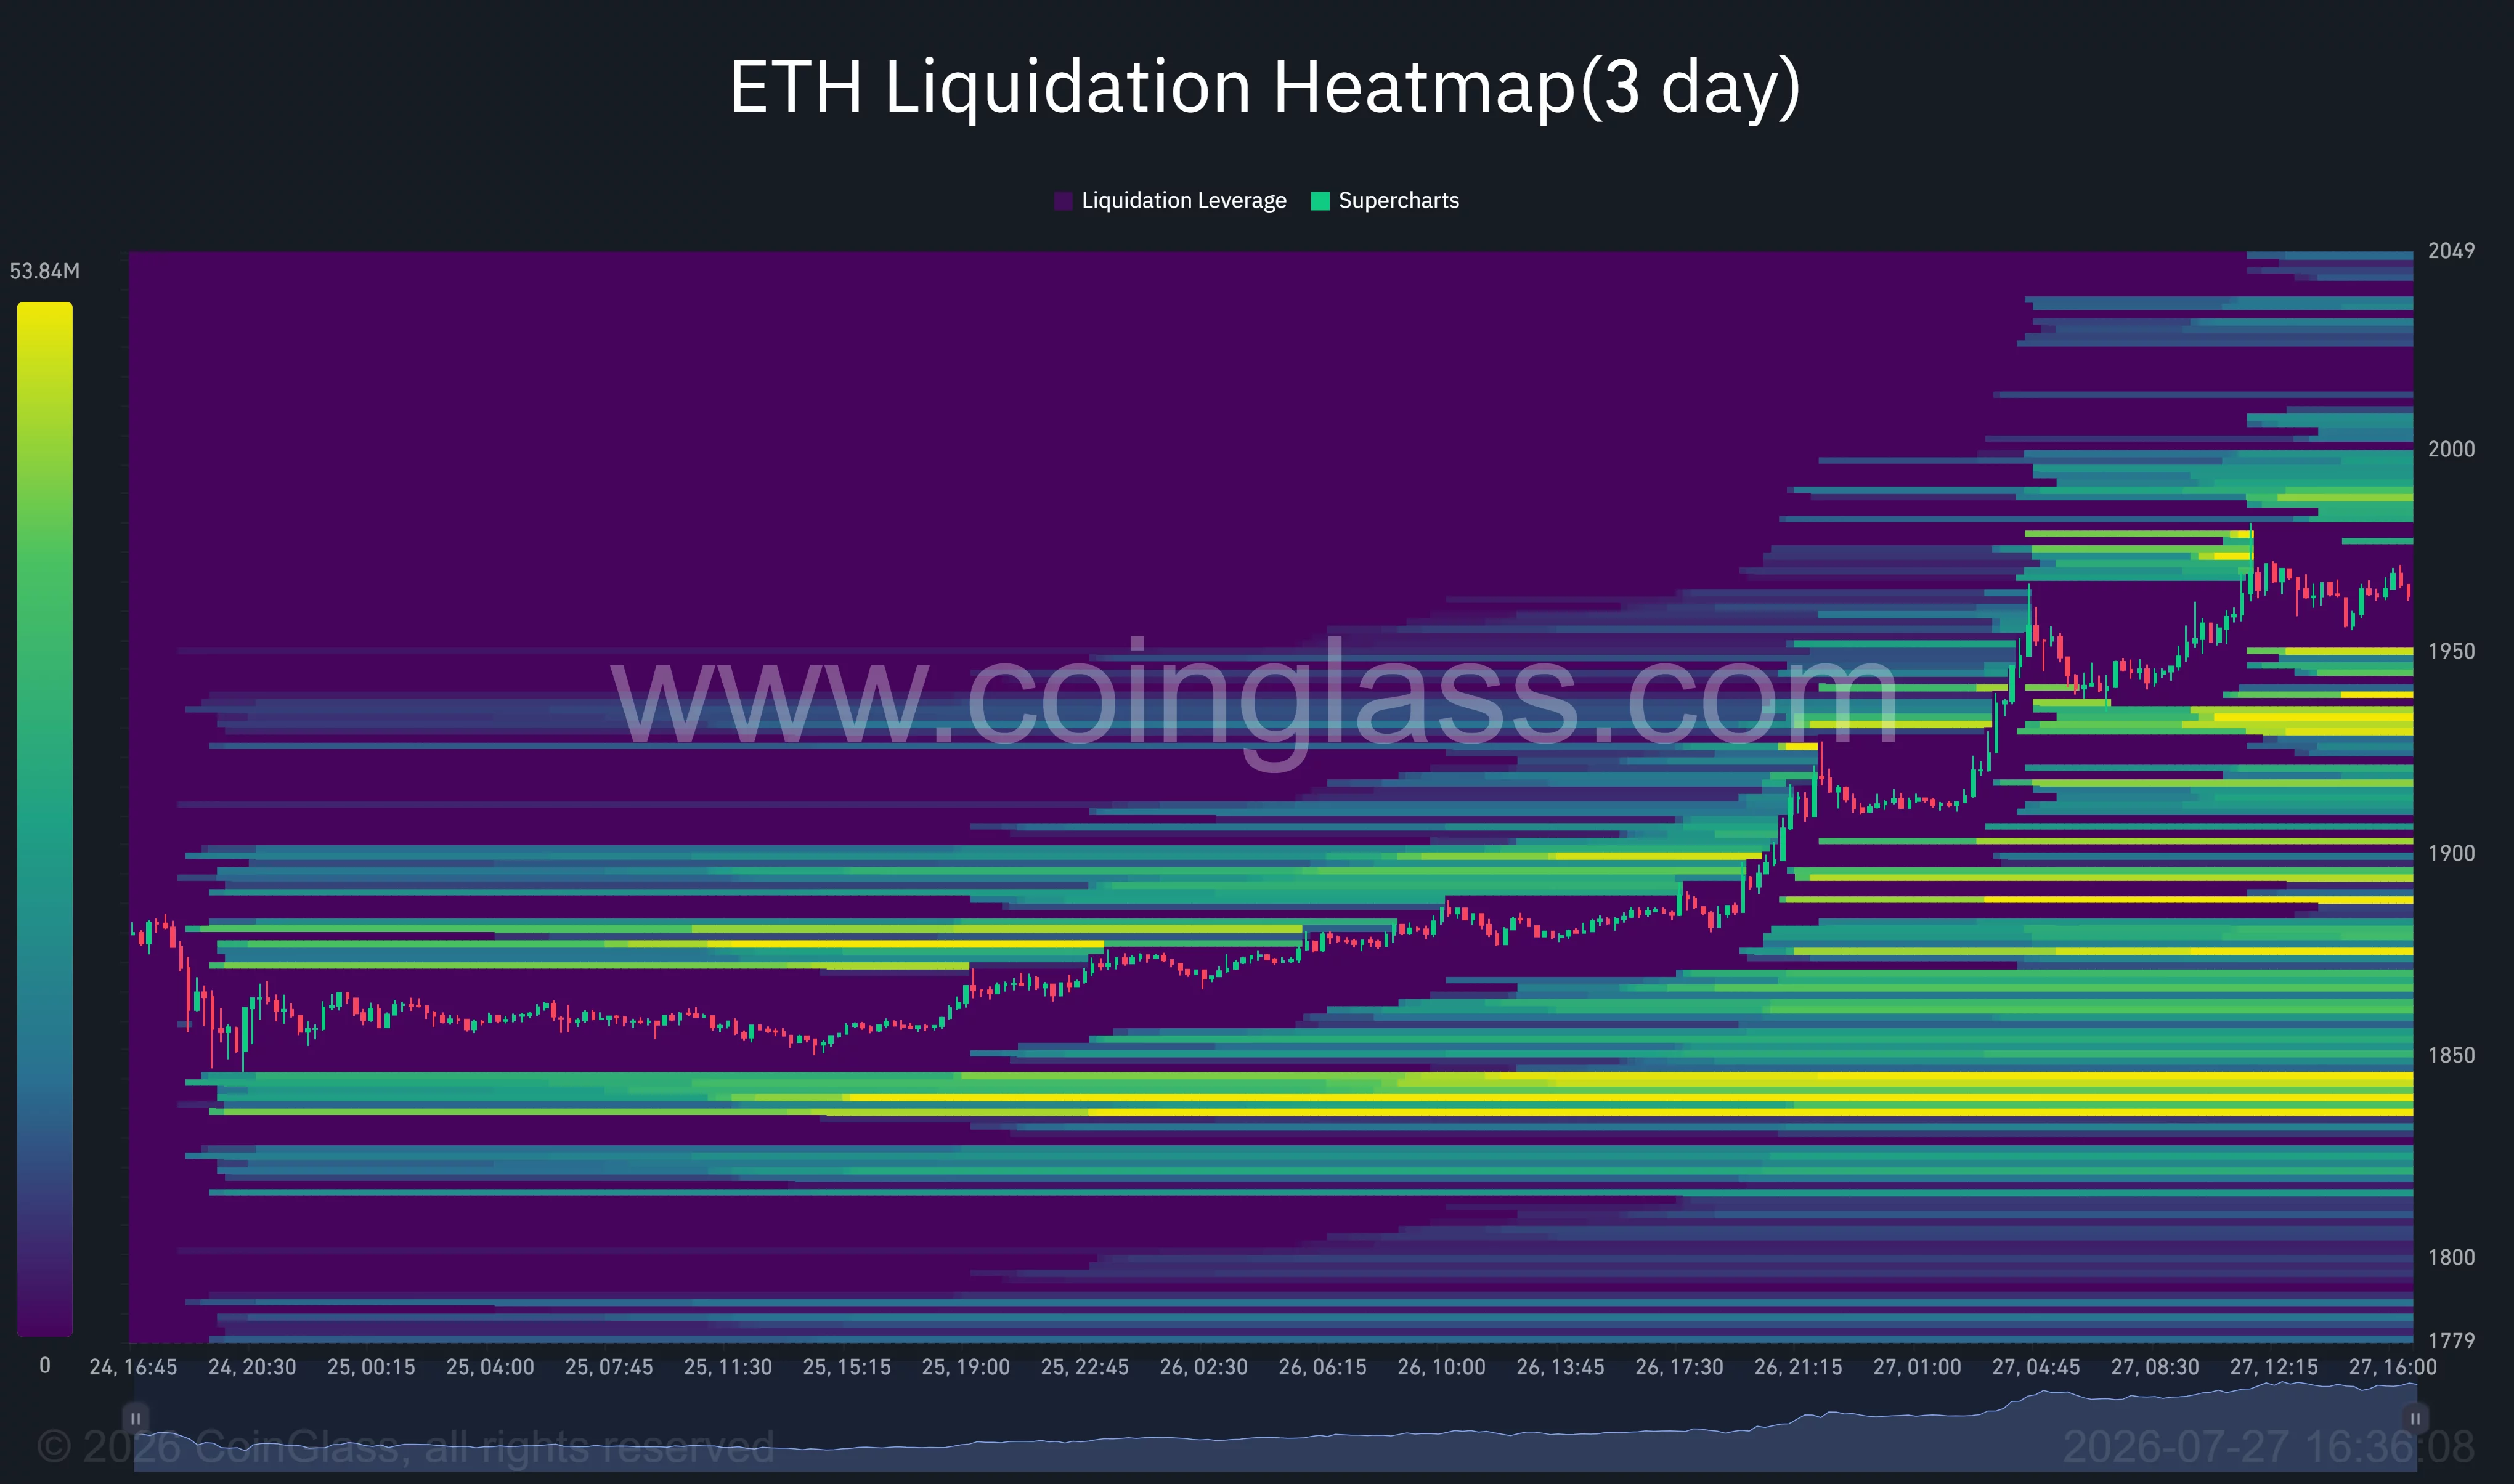
A move into those levels could force leveraged short positions to close through market purchases. That process may create another short squeeze and help ETH move through resistance, particularly if spot volume remains elevated.
The heatmap also maps downside liquidity around $1,945–$1,930, followed by larger concentrations near $1,900–$1,880. A rejection from $2,000 could attract price toward those areas as leveraged long positions unwind.
The largest lower cluster appears around $1,835–$1,850. That zone aligns with the 4-hour channel floor and gives bulls a major defensive area if ETH loses $1,880. A break below it would expose $1,802, followed by the daily Supertrend near $1,772.
Analysts map $2,350 to $2,500 ETH targets
According to market commentator Michaël van de Poppe, Ethereum may consolidate before beginning another upward leg.
“Matter of time until it runs towards $2,500 (which is the other side of the range).”
Analyst Ted Pillows also pointed to rising spot demand but placed the immediate condition at $2,000.
“If Ethereum manages to break and reclaim $2,000 here, it could rally to May highs.”
Pillows’ chart places intermediate resistance near $2,191 and a larger supply zone around $2,350–$2,400. These targets remain conditional on ETH closing above $2,000 and holding that level during a retest.
Failure to reclaim $2,000 would favor short-term consolidation toward $1,930 or $1,881. The bullish structure remains intact above the ascending channel floor, while a decisive loss of $1,850 would weaken the current recovery thesis.
Disclosure: This article does not represent investment advice. The content and materials featured on this page are for educational purposes only.