
Bitcoin has fallen back toward $62,500 after U.S. producer inflation accelerated beyond expectations, adding fresh uncertainty ahead of the Federal Reserve’s June policy meeting.
- U.S. producer inflation jumped 1.1% in May, pushing annual PPI to 6.5% and weighing on Bitcoin ahead of the June Fed meeting.
- Bitcoin slipped toward $62,500 after the inflation report, while traders watch resistance near $65,000 and support around $60,000.
- Glassnode reported a 78% drop in spot Bitcoin ETF trading volume, signaling weaker institutional demand for BTC exposure.
According to data from the U.S. Bureau of Labor Statistics, the Producer Price Index rose 1.1% in May, well above Wall Street forecasts for a 0.6% monthly increase.
Annual producer inflation reached 6.5%, exceeding analyst expectations of 6.4% and accelerating from the previous 6.0% reading. The report also showed Core PPI, which excludes food and energy costs, increased 0.8% compared with forecasts for a 0.4% gain.
Minutes after the data release, Bitcoin (BTC) surrendered part of its earlier advance and slipped back toward the $62,500 area after briefly trading above $63,000. Market data showed the move triggered a sharp red candle on the 15-minute chart as traders reacted to the stronger-than-expected inflation figures.
At the same time, another macro development added pressure to risk assets. Crude oil climbed to $90.8 per barrel after comments from U.S. President Donald Trump regarding potential military action against Iran and possible U.S. control over parts of the country’s oil infrastructure.
New inventory data also pointed to tightening global oil supplies, increasing concerns that energy costs could add to inflation pressures.
Technical indicators point to key resistance levels
While inflation data weighed on sentiment, Bitcoin remains above a critical support zone that several analysts continue to monitor closely.
According to analyst Daan Crypto Trades, bulls are defending the $60,000 area alongside Bitcoin’s weekly 200 moving average. Daan stated that a break below that level would likely keep the larger downtrend intact, while maintaining support could allow a recovery attempt toward higher resistance levels.
Technical charts show Bitcoin consolidating inside a symmetrical triangle on the four-hour timeframe after rebounding from last week’s selloff. The pattern has formed near a major support area around $59,000-$60,000.
Momentum indicators have also improved modestly, with the four-hour MACD producing a bullish crossover and the Relative Strength Index recovering toward neutral territory.
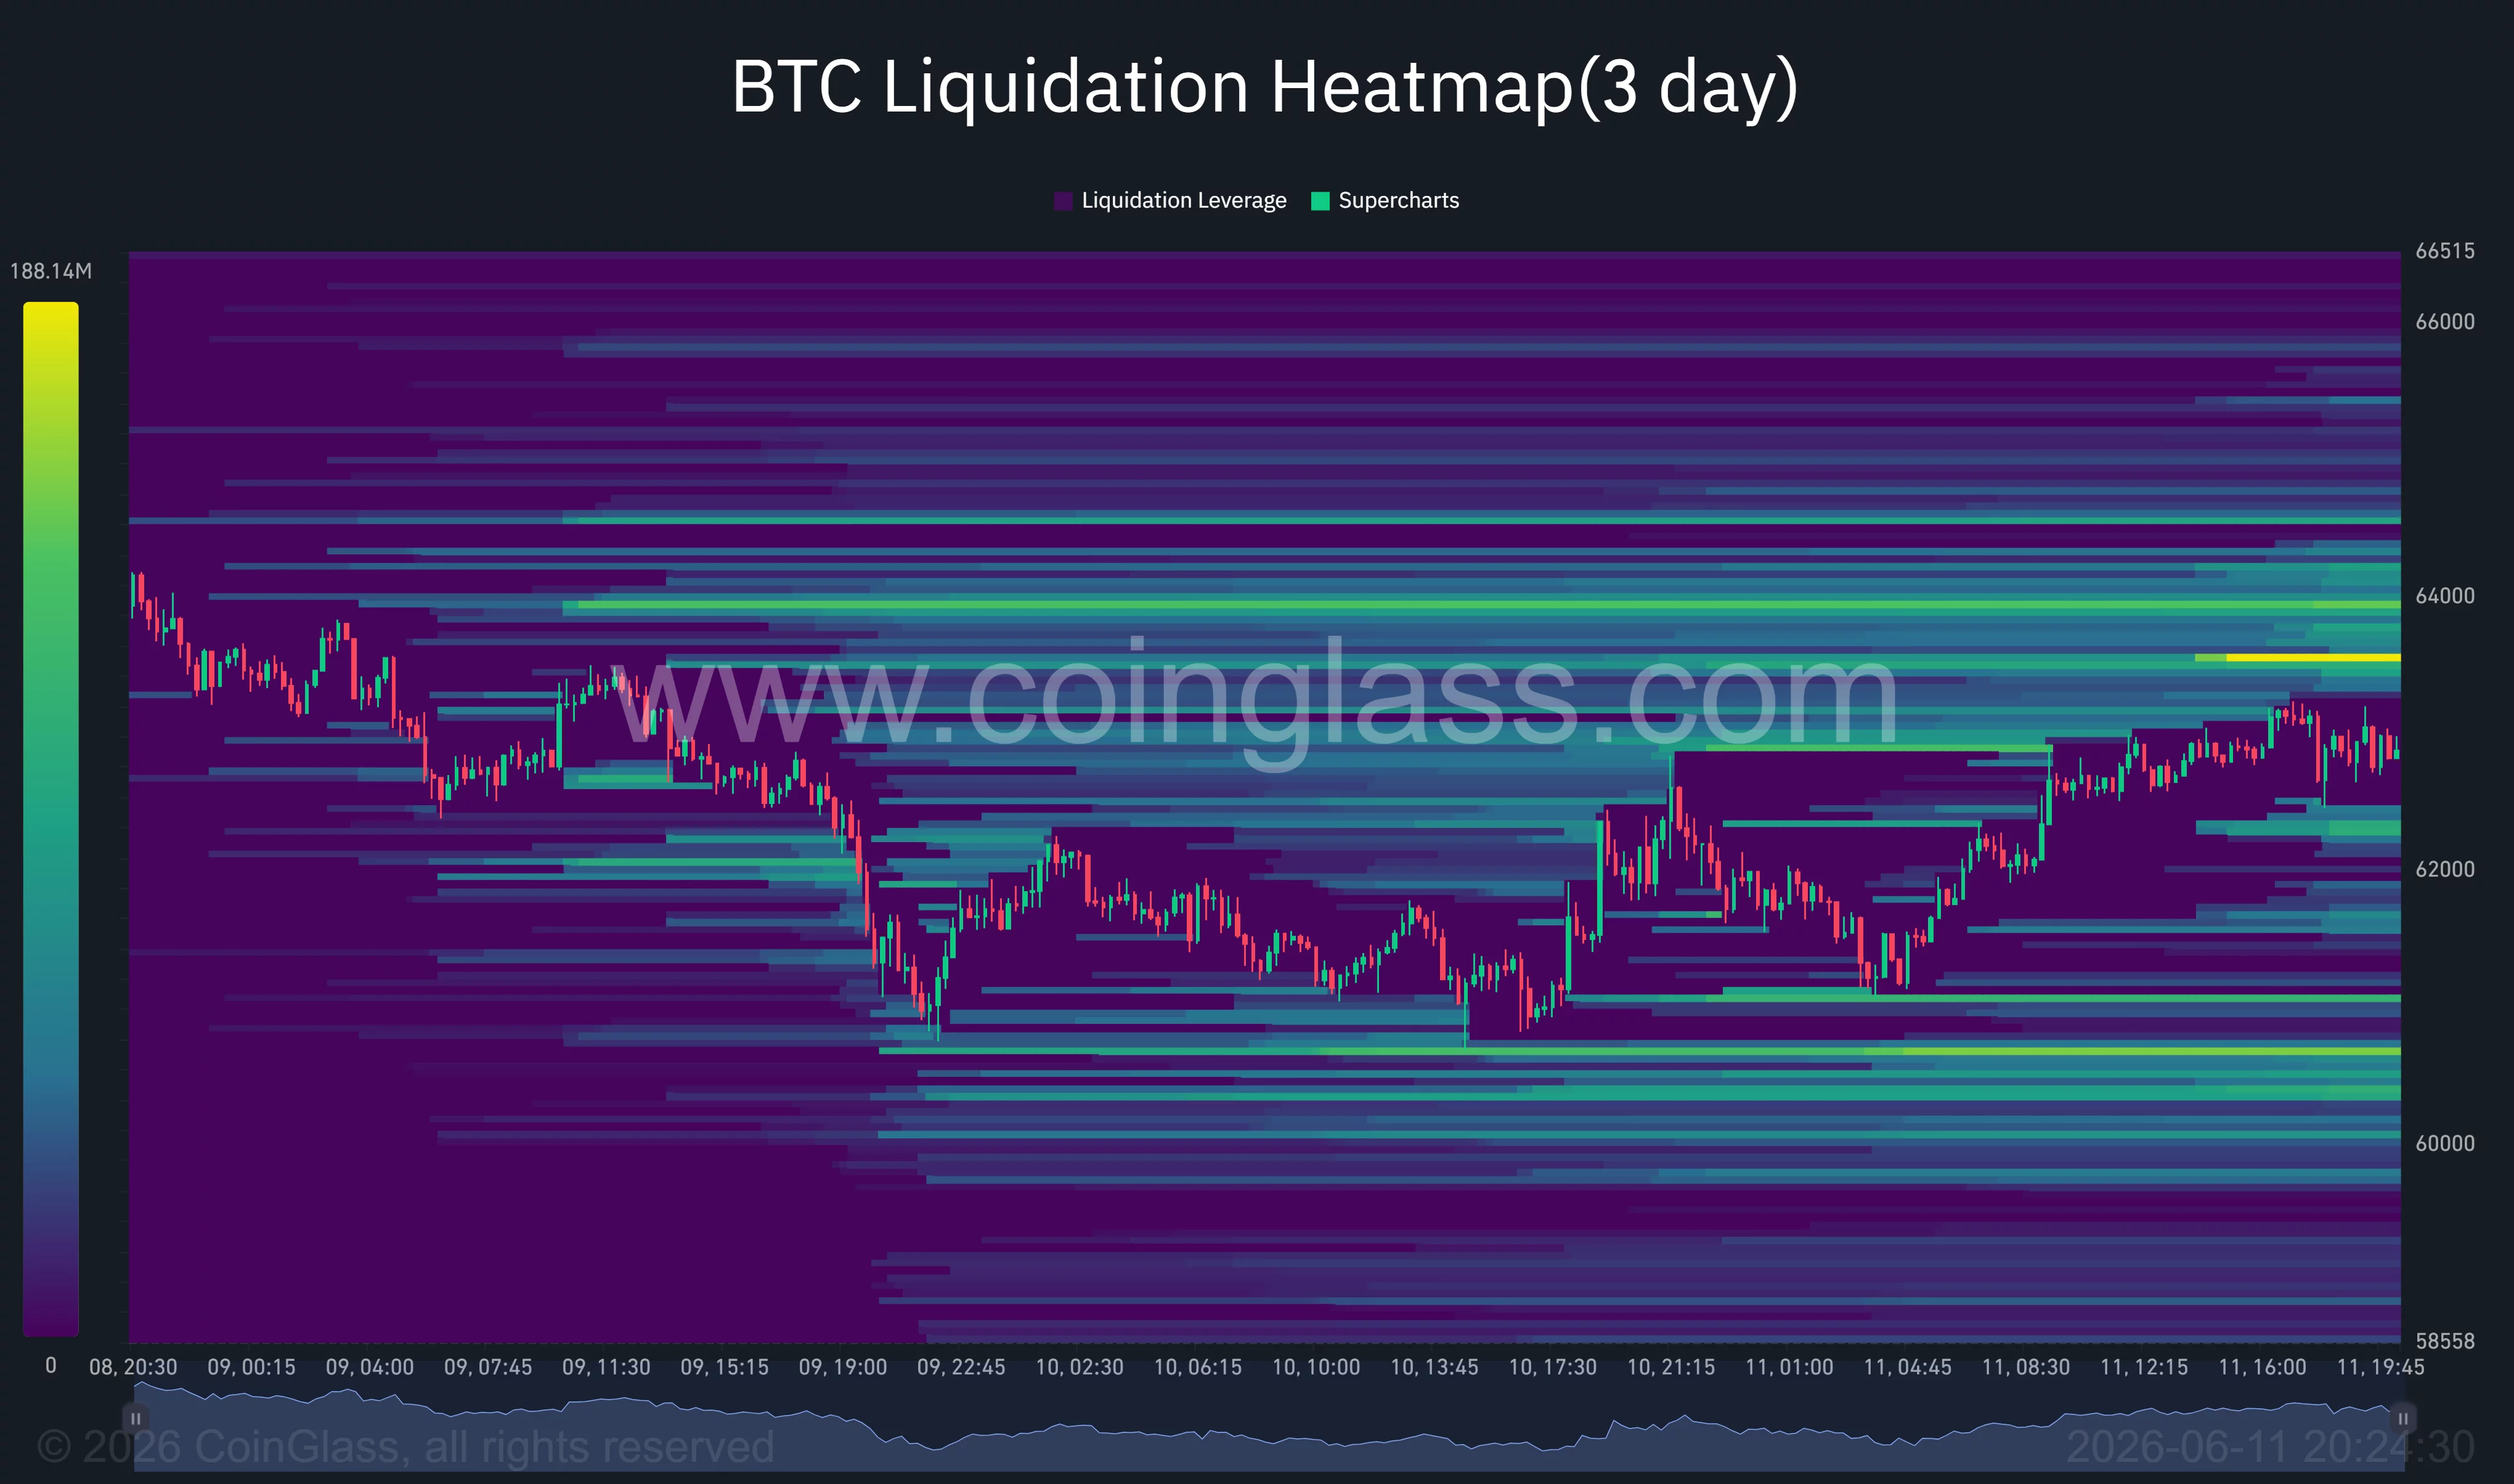
Liquidation data from CoinGlass indicates that a large concentration of leveraged short positions sits between $63,500 and $65,000. Those levels could attract price in the short term if buyers manage to force a squeeze through nearby resistance.
A move into that zone would place Bitcoin near the former neckline of a major rounding-top formation that recently broke down on higher timeframes.
Longer-term downside risks remain active
Despite signs of stabilization above support, several indicators suggest the larger market structure remains under pressure.
As previously reported by crypto.news, Bitcoin completed a rounding-top pattern between March and early June. The formation broke below its neckline near $65,000, a level that had repeatedly acted as support before last week’s decline.
Using the depth of the pattern, the measured downside objective points toward roughly $47,000, representing about a 25% downside from current prices. The projected target coincides with a historical support area that previously served as resistance during Bitcoin’s recovery earlier this year.
Institutional demand has also weakened. According to Glassnode, the 30-day moving average of U.S. spot Bitcoin ETF trading volume has fallen from $4.4 billion per day in October 2025 to approximately $960 million per day, a decline of 78%.
Glassnode also reported a 49% drop in trading volumes among publicly traded Bitcoin treasury companies, stating that speculative appetite for Bitcoin exposure through traditional financial channels has largely retreated.
Attention now turns to the Federal Open Market Committee meeting scheduled for June 16-17, the first under Trump-backed Fed Chair Kevin Warsh.
Prior to the inflation release, markets largely expected policymakers to leave interest rates unchanged. Following the stronger producer inflation data and rising energy prices, investors are reassessing how long the central bank may need to maintain restrictive monetary policy.
Although U.S. consumer inflation data released a day earlier came in below expectations, Thursday’s producer inflation report has complicated the outlook, leaving Bitcoin traders caught between oversold technical conditions and renewed macroeconomic pressure.
Disclosure: This article does not represent investment advice. The content and materials featured on this page are for educational purposes only.