XRP price is nearing a significant move in July as its triangle pattern nears confluence and a recently launched leveraged exchange-traded fund gains momentum.
Ripple (XRP) was trading at $2.20 on July 1, where it has been stuck in the past few weeks. This price is about 15% above the lowest level in July and 35% higher than the year-to-date low.
A potential catalyst for the XRP price is that the Teucrium 2x Long Daily XRP ETF has continued to gain momentum.
Data shows that the XXRP ETF has had inflows in all weeks since its launch in April. It had the biggest weekly inflow last week, when it added $33 million in assets.
XXRP ETF now has over $158 million in assets, a notable amount because it is one of the most expensive funds in Wall Street. It has an expense ratio of 1.89%, much higher than other leveraged funds. For example, the popular Daily Semiconductor Bull 3X Shares ETF has a ratio of 0.75%.
The rising XXRP ETF inflows are a sign that future spot XRP funds will have demand on Wall Street. The odds that the SEC will approve a spot XRP ETF have increased to 86%.
XRP price has also wavered despite major milestones in the network. For example, the SEC vs Ripple Labs case has ended, which will free the company to reach deals with other US firms.
Further, Ripple will be a major beneficiary of the GENIUS Act, which will regulate stablecoins. The RLUSD stablecoin’s market cap has jumped to $455 million, a figure that will likely continue soaring this year.
XRP price technical analysis
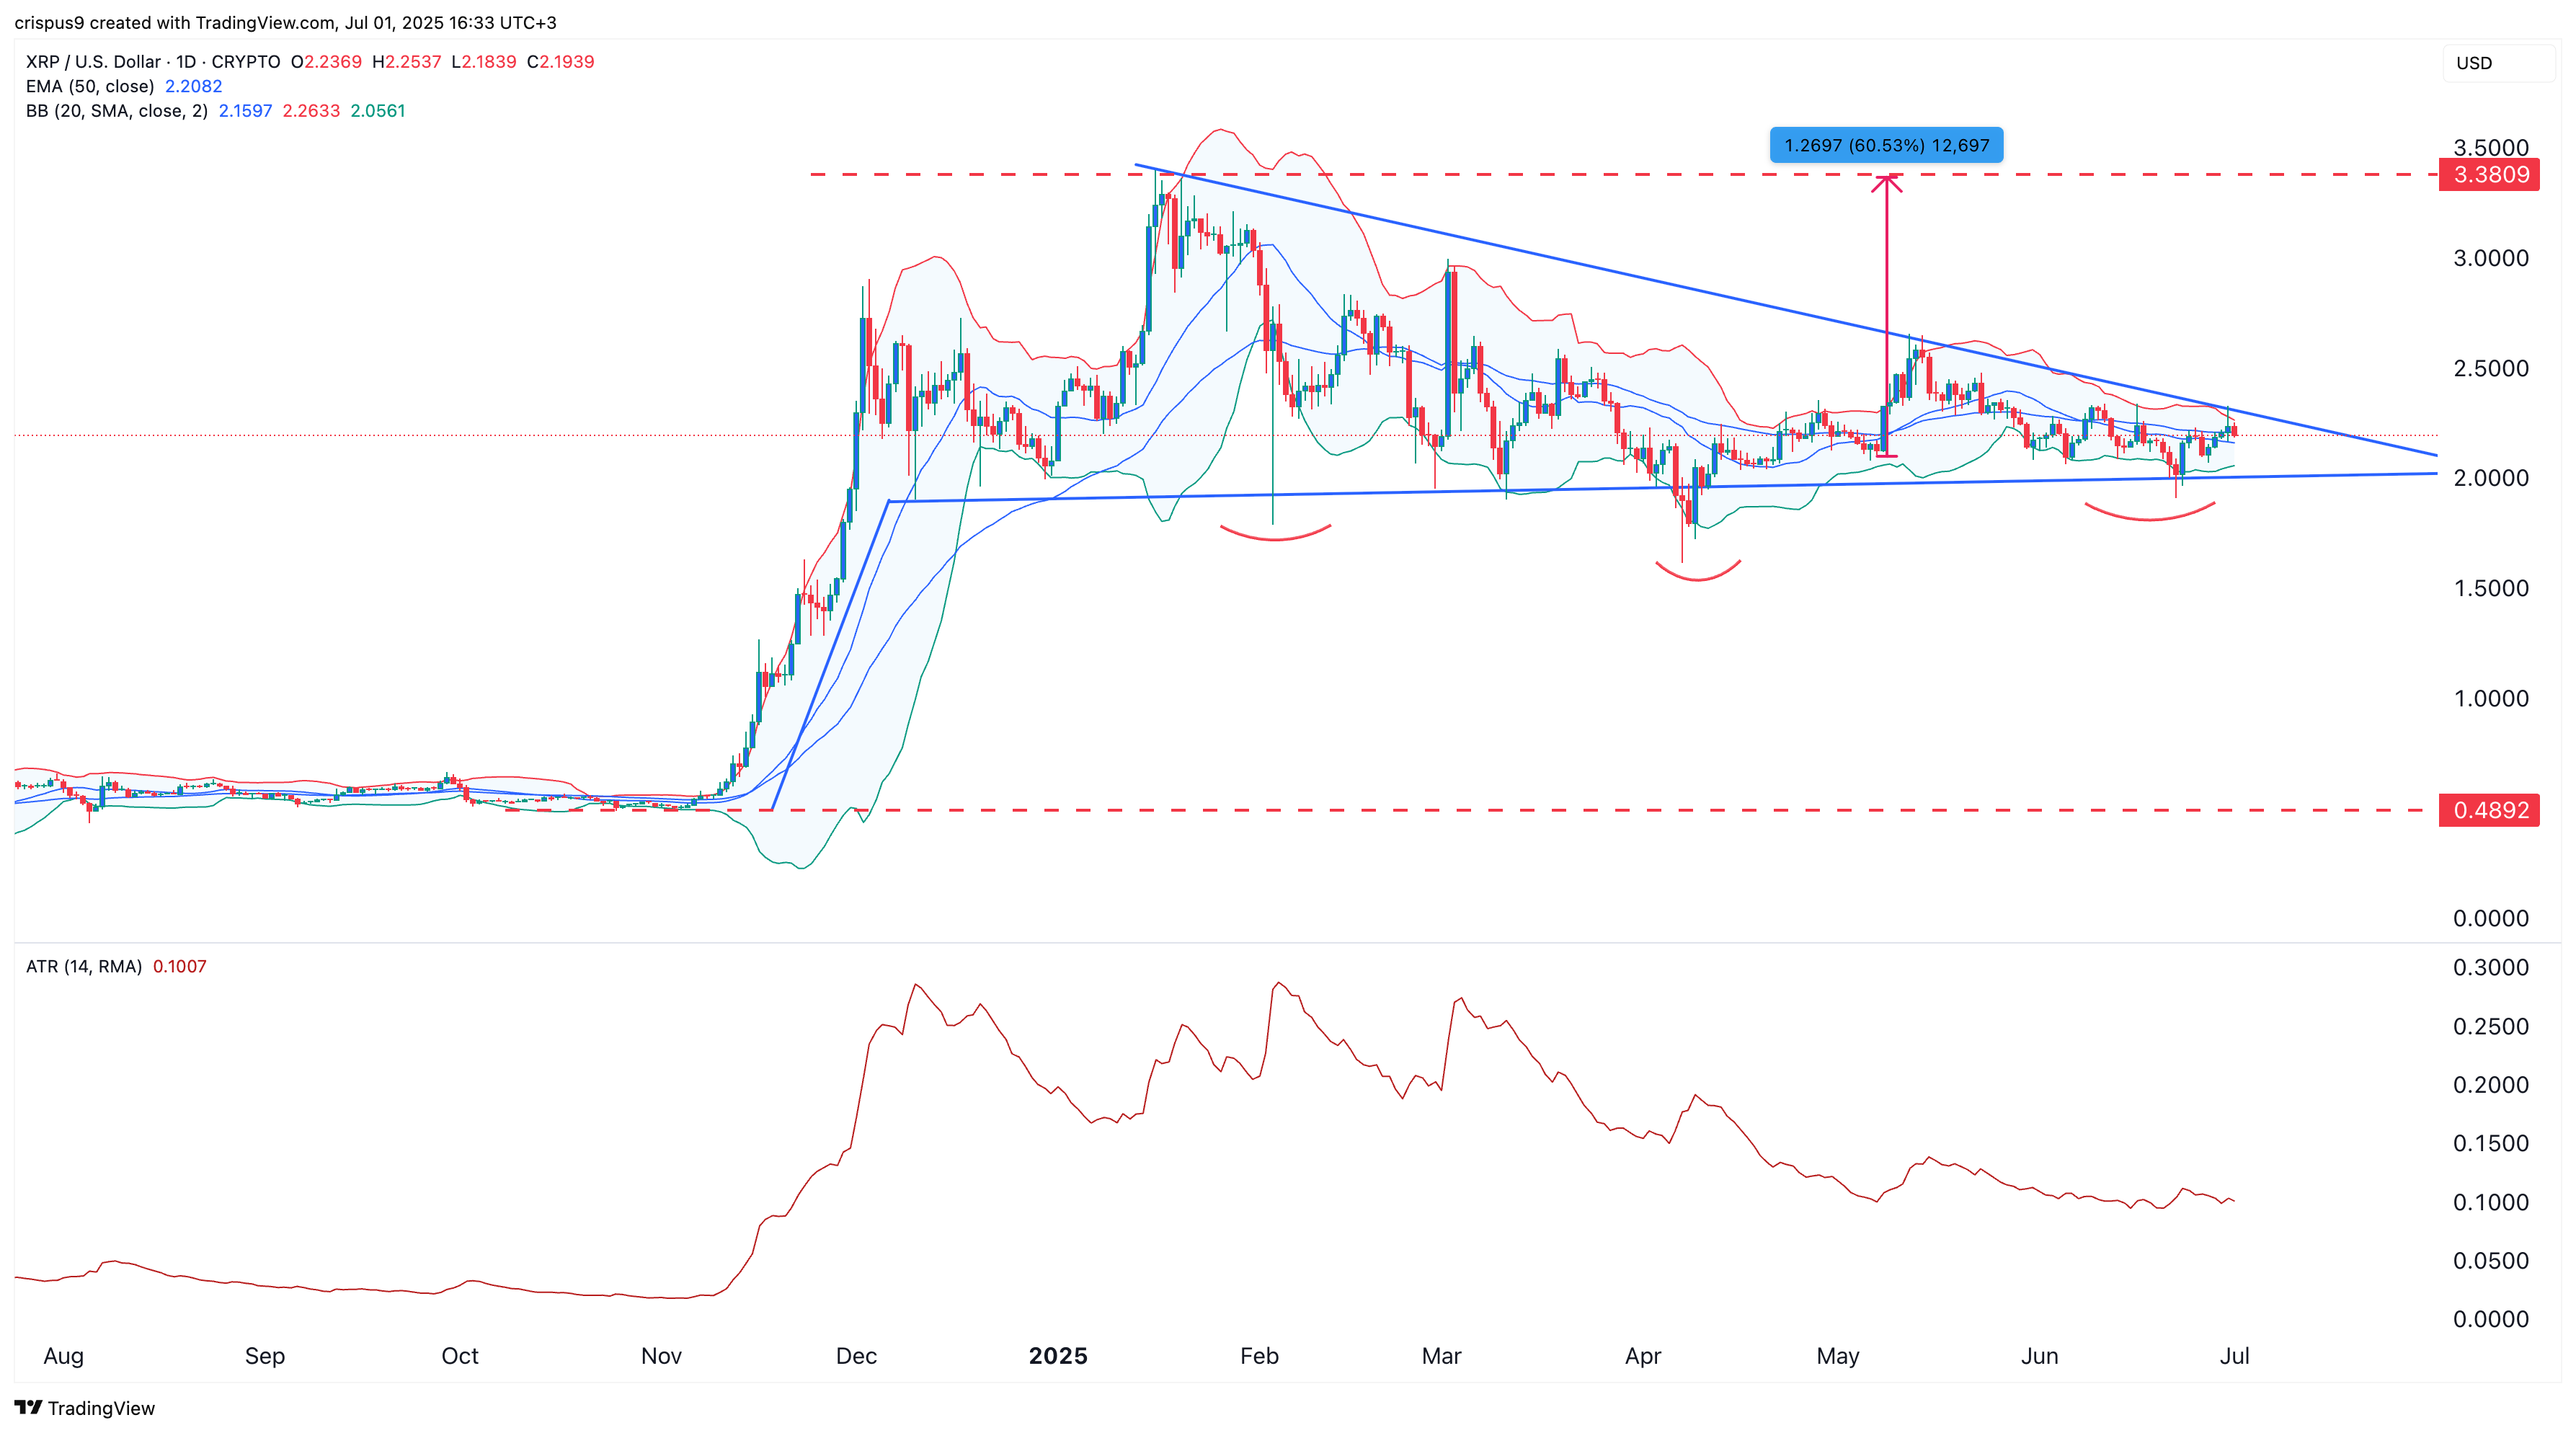
The daily chart shows that the XRP price has remained in a tight range in the past few months. It has held steady above the crucial support level at $2, which coincides with the lower side of the symmetrical triangle pattern.
This triangle pattern formed after the token surged in November last year, making it a bullish pennant. A pennant is a popular bullish continuation pattern.
The other bullish aspect is that the Average True Range has dropped, and the spread between the two lines of the Bollinger Bands has narrowed. This is a sign that its volatility has dried up.
Therefore, the token will likely have a strong bullish breakout, with the next point to watch being at $3.8, up by 60% from the current level.