
Pepe price rose for four consecutive days as smart money investors bought the recent dip and as Ethereum crossed the resistance at $2,600.
Pepe coin (PEPE) climbed from last week’s low of $0.000011 to a high of $0.00001285. This rebound occurred in a high-volume environment, with 24-hour trading volume surging by 40% to $1.05 billion.
Pepe rallied for several reasons. First, the recent crypto market crash has stalled over the past few days. Bitcoin (BTC) has risen from last week’s low of $103,000 to $105,400, while Ethereum (ETH) rose to $2,650
Pepe is highly sensitive to Ethereum price movements because it is the second-biggest meme coin in its ecosystem after Shiba Inu (SHIB). For instance, it crashed by 81% between its high in November last year and its low in April, as Ethereum tumbled from $4,000 to $1,300.
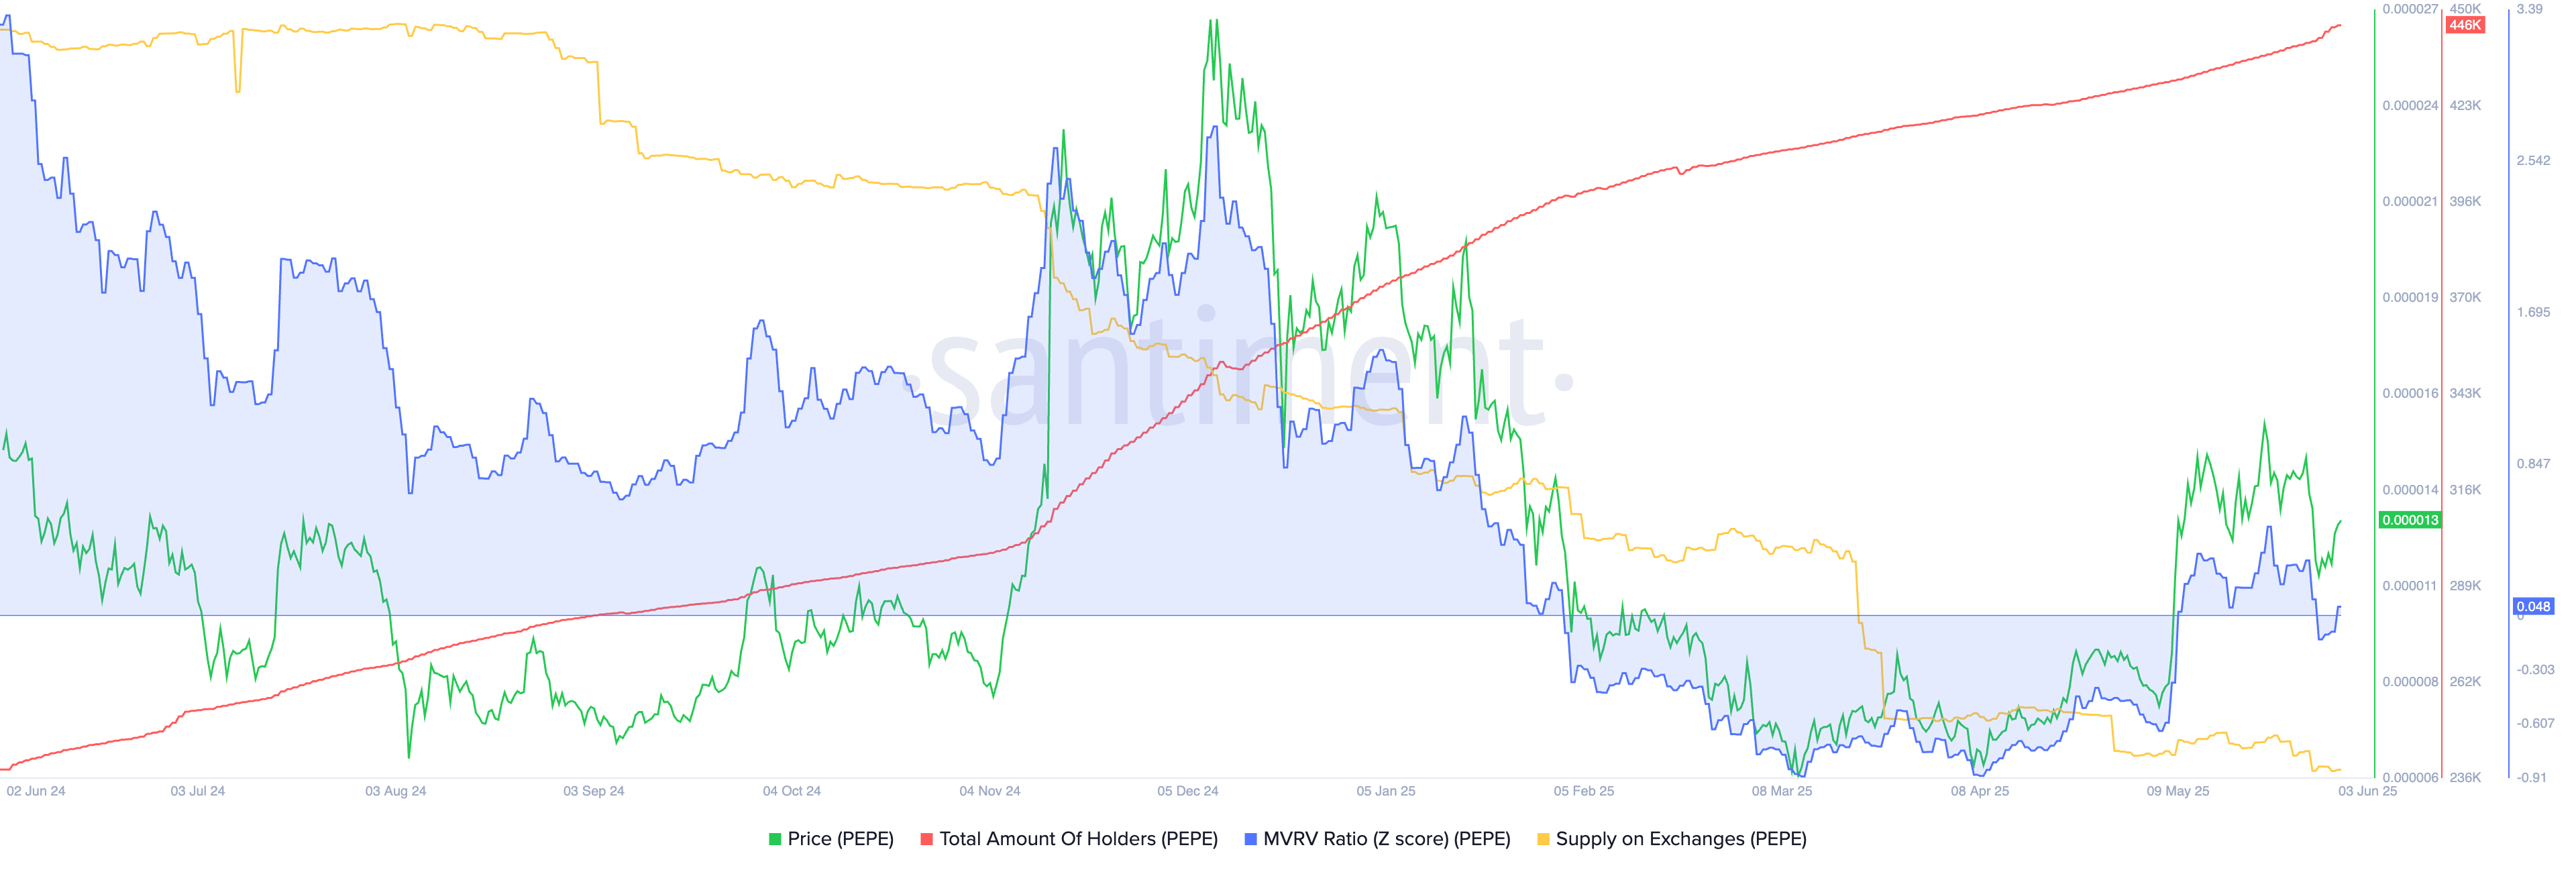
Pepe has also jumped as on-chain data indicates accumulation by both smart money and retail investors. The number of PEPE holders has risen to 446,000, up from 366,000 on January 1.
Nansen data shows that tokens held by smart money investors have surged by 150% in the past 30 days to 642 billion coins. Similarly, those held by whales have increased by 4% to 10.06 trillion—a sign that these investors expect prices to continue rising.
Additional data shows that the supply of Pepe coins on exchanges has been in a steady decline. It dropped to 104.85 trillion, down from 160 trillion at the start of the year. Falling supply suggests that investors are holding rather than selling.
Pepe price technical analysis
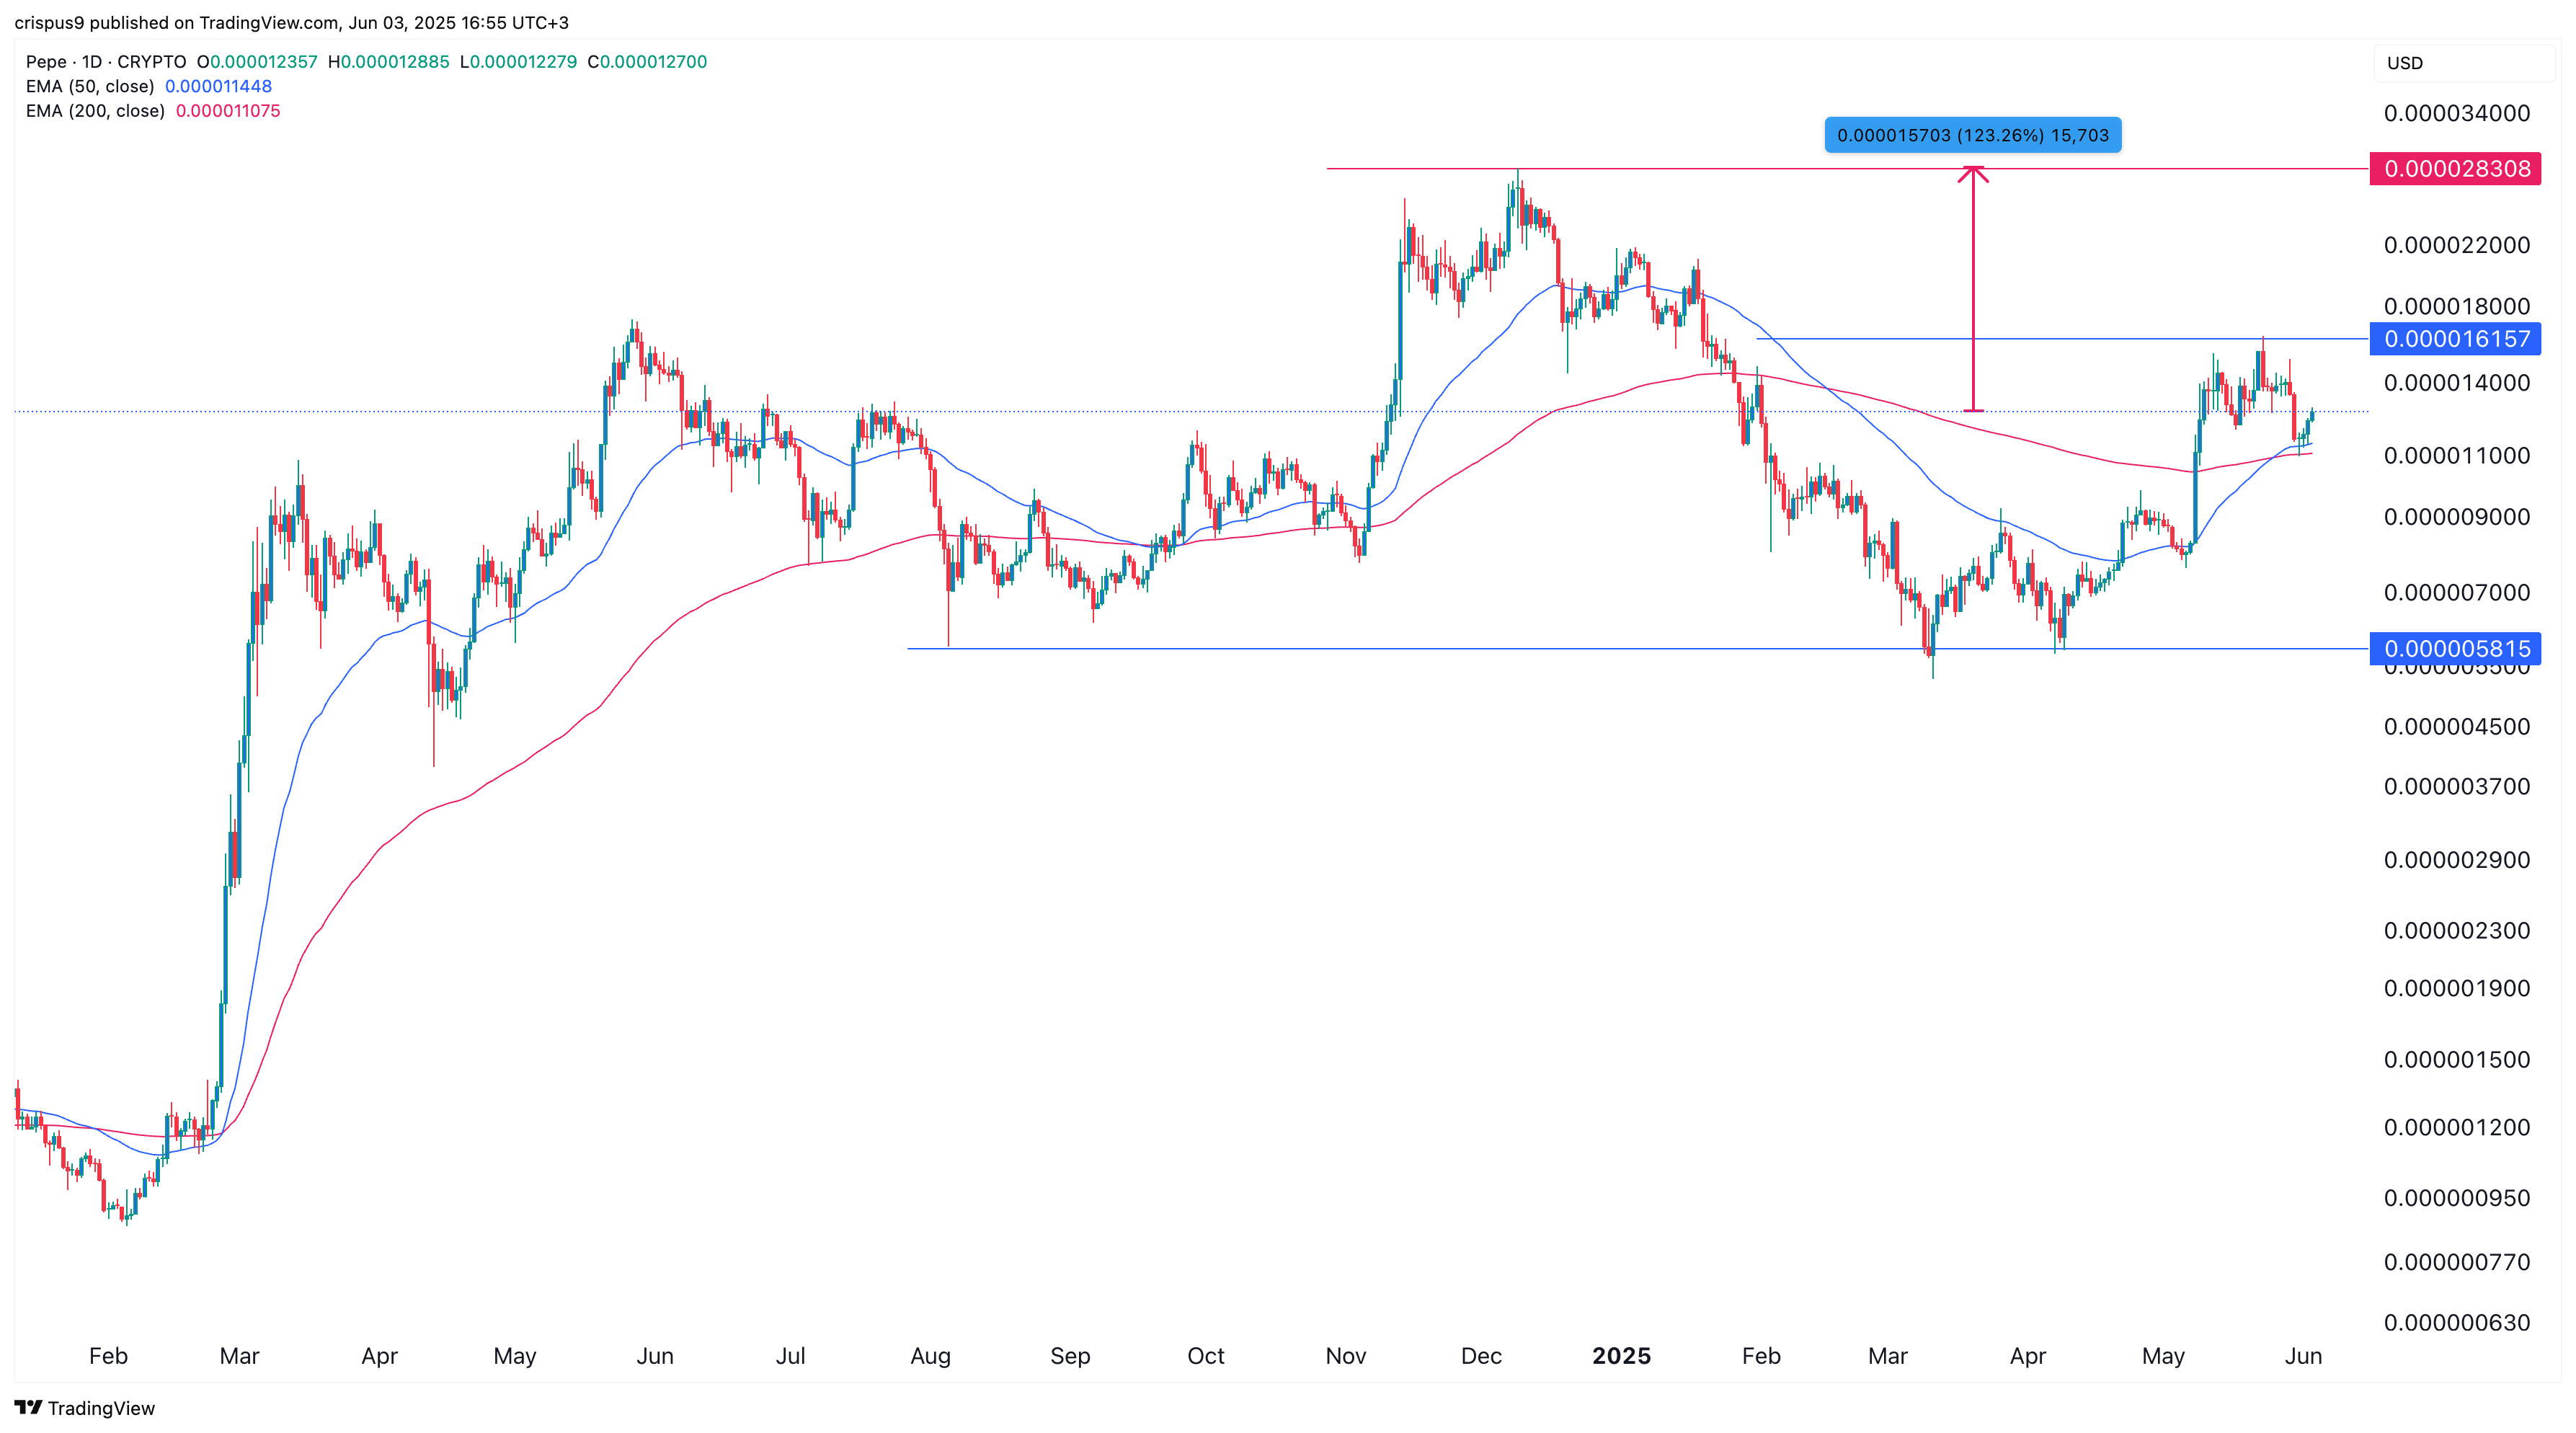
The daily chart shows that Pepe has rebounded from a low of $0.000005815 in April to $0.00001260. It has formed a golden cross pattern, with the 50-day and 200-day moving averages crossing, a technical setup that often signals long-term bullish potential.
Therefore, further gains will be confirmed if the price breaks above the key resistance level at $0.00001615, the May high. If that occurs, the next level to watch is $0.00002830, representing a 123% increase from the current price. A drop below the support at $0.000010 would invalidate the bullish outlook.