
ONDO price confirmed a breakout from a bullish pennant pattern today as its TVL hit a new all-time high. Can it recover from its August losses?
- ONDO price has broken out of a bullish pennant pattern.
- The total value locked within Ondo Finance has surpassed $1.5 billion.
- Whales have increased accumulation of ONDO over the past two days.
According to data from crypto.news, Ondo (ONDO) rose over 12% to an intraday high of $1.06 on Wednesday, before settling at $1.01 at the time of writing. The token’s rally today marks a shift from the downtrend it had been in since mid-August. Its price is still down 9% from its August high.
The main reason why Ondo rallied today is that the total value locked in the Ondo Network surpassed the $1.5 billion milestone, recording a new all-time high. This surge was triggered by the sharp growth of Ondo Global Markets, its newly launched platform for tokenizing U.S. stocks and ETFs.
Notably, the platform has accrued over $105 million in TVL within a week of its launch, making it the largest platform for tokenized stocks and ETFs.
As more amount of tokens are locked and staked on Ondo Finance, it will reduce selling pressure on the ONDO token. This in turn could help bulls to regain control and help push its price higher.
ONDO’s gains today were also fueled by renewed interest from whales. Data from Santiment reveals that holders with balances between 10,000 and 10 million tokens have increased over the past two days. When whales start accumulating a token, it often prompts retail investors to follow, an effect that could help support the token’s gains in the coming days.
ONDO price has broken out of a bullish pennant
A look at the daily chart reveals that ONDO has been forming a bullish pennant pattern since July.
It is a short-term continuation pattern that is formed when an asset’s price prints back-to-back green candles as its price moves higher, thereby creating what is called a flagpole, which is then followed by a brief consolidation period, during which the price moves within converging trendlines, forming a small symmetrical triangle or pennant shape.
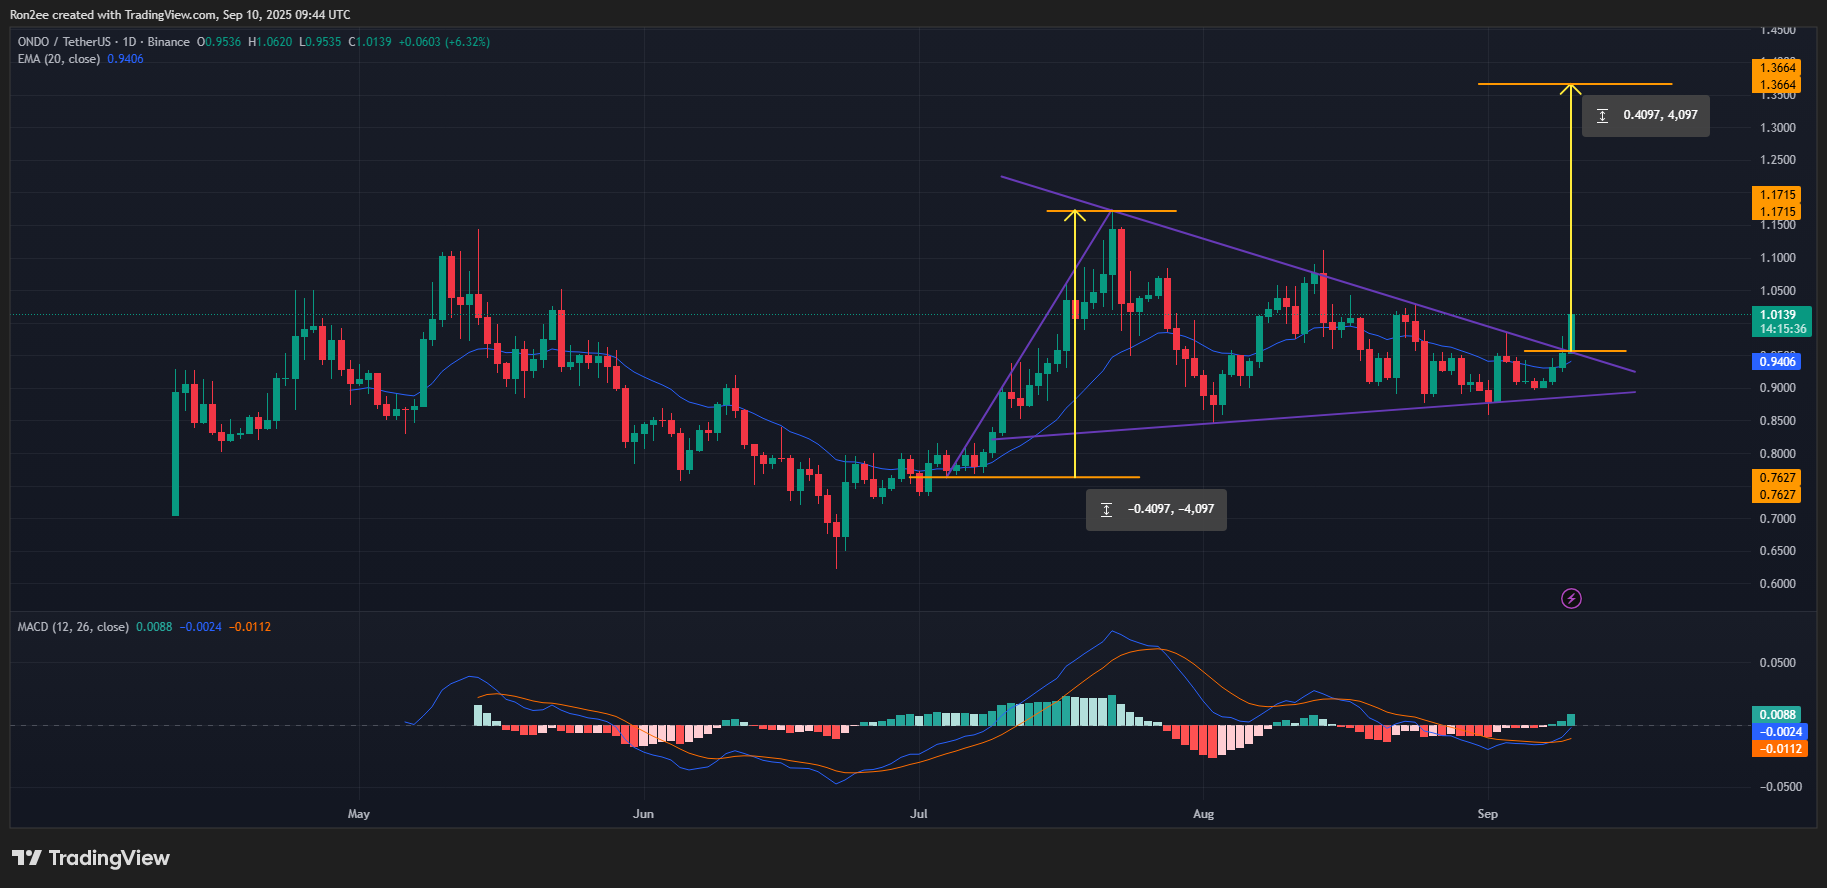
ONDO price has already broken upwards from the structure, confirming that buyers have regained control after the consolidation phase.
ONDO is also trading above the 20-day exponential moving average at press time, which further validates the current breakout.
Among other bullish technicals was the Moving Average Convergence Divergence indicator, which showed a positive crossover. When considering the current setup, this means market sentiment is tilting in favor of buyers, which supports the case for further upside in upcoming sessions.
Based on this, ONDO bulls would most likely attempt to break through $1.17, which has acted as resistance during its run in July and is also the highest point of the upper trendline of the pennant pattern.
If successful, ONDO could be set for a run up to $1.36, the full projected move based on the bullish pennant breakout. At press time, the target lies about 35% above its current price level of $1.01.
A drop below the 20-day EMA at $0.94, which traders often view as short-term support levels, would invalidate the setup.
Disclosure: This article does not represent investment advice. The content and materials featured on this page are for educational purposes only.