
FLR, the native token of Layer-1 blockchain Flare, is showing early signs of a bullish breakout following its partnership with a NASDAQ-listed company.
In a June 11 post on X, Flare announced that it is teaming up with VivoPower International, a multinational sustainable energy firm, to help generate yield on VivoPower’s XRP holdings.
VivoPower will initially deploy $100 million XRP through Flare’s native protocols like Firelight, and reinvest that income into its core XRP holdings to create a “perpetually compounding and capital-efficient” treasury.
For Flare, the partnership represents a significant milestone in demonstrating the network’s capacity to support institutional-grade utility for XRP.
The collaboration also highlights the growing relevance of Flare’s broader infrastructure, particularly its FAssets system, which enables non-smart contract tokens like XRP to interact with DeFi protocols while preserving their native security models.
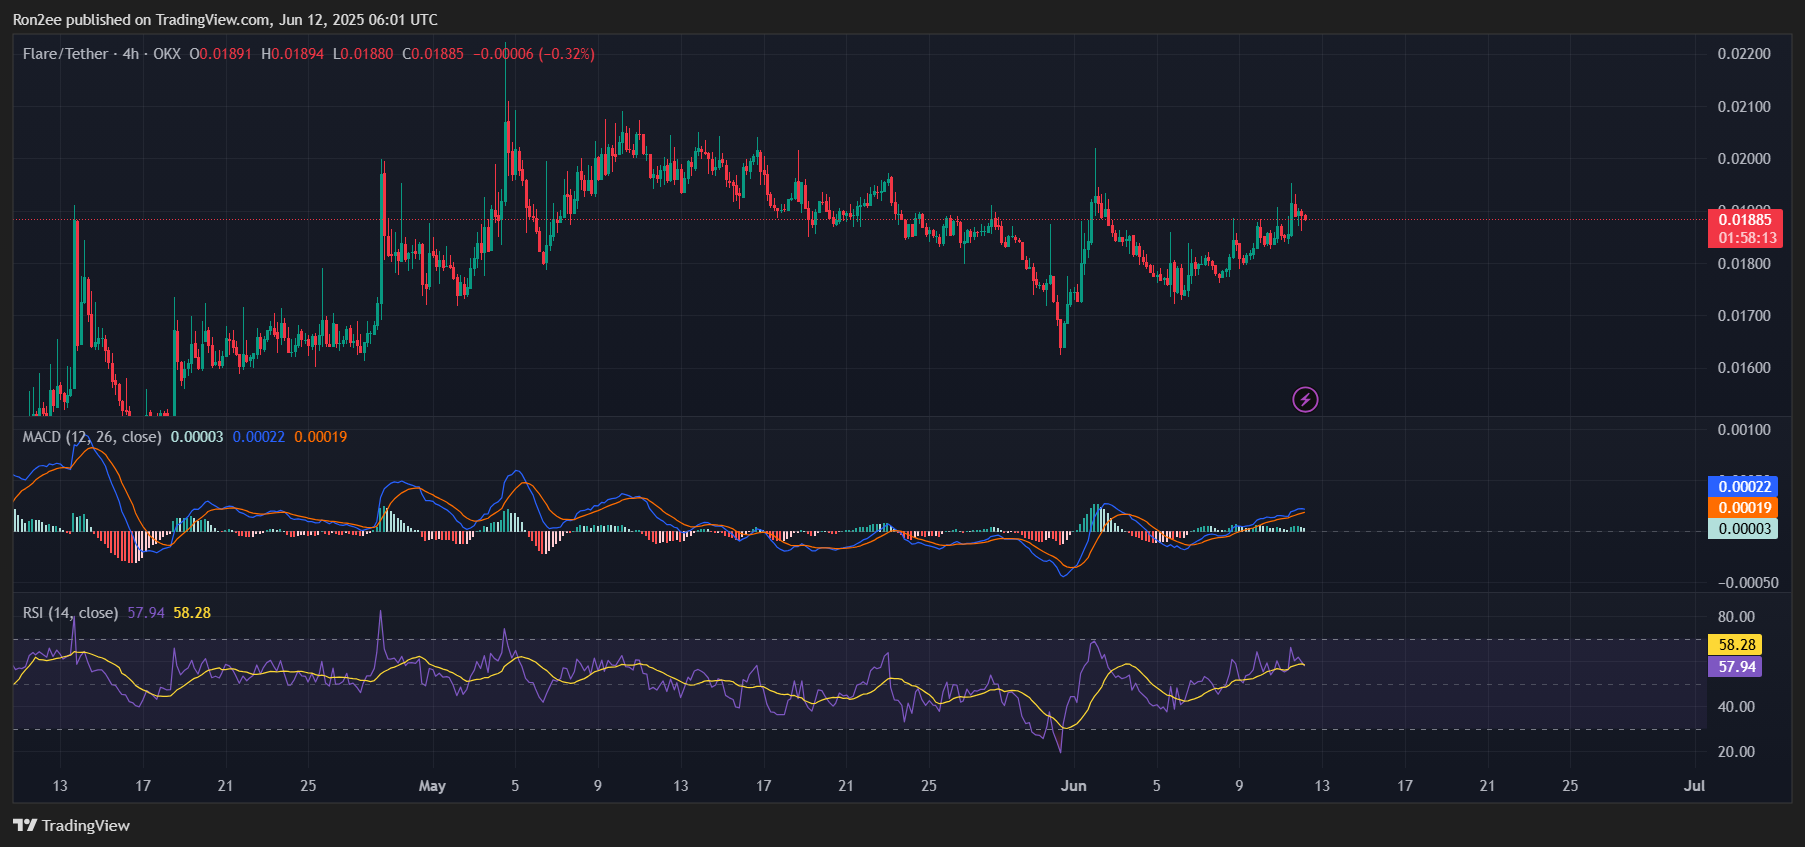
Despite the positive news, Flare (FLR) recorded only a modest price move, gaining 5.5% to reach an intraday high of $0.0192 before settling at $0.0188.
At press time, its market capitalization stood at approximately $1.27 billion. However, daily trading volume surged over 120% compared to the previous day, indicating heightened market activity and growing interest.
FLR price analysis
From a technical perspective, FLR appears to be trading within an ascending parallel channel that has been forming since June 5. A breakout from this structure could set the stage for a sustained upward move.
The 20-day and 50-day simple moving averages have formed a golden cross, a classic signal that suggests upward momentum may be building.. Momentum indicators such as the MACD and RSI are also trending upwards, further supporting the positive outlook.
If the bullish momentum continues, the next key resistance lies near the $0.02 psychological level, which also aligns with the 61.8% Fibonacci retracement level. A confirmed breakout above this zone could validate the pattern and fuel further gains.
Conversely, if it pulls back, support is expected near the $0.0185 level. A sustained drop below this threshold could invalidate the upside setup and lead to a retest of the 50-day SMA around $0.0181 before any potential recovery.
Disclosure: This article does not represent investment advice. The content and materials featured on this page are for educational purposes only.