
Bitcoin is on the verge of confirming a powerful golden cross pattern, which could set the stage for a breakout rally toward the $150,000 mark.
Bitcoin (BTC) surged to a new all-time high of $111,544 on Thursday, May 22, afternoon Asian time, breaking past its previous record of $109,400 from just the day before. This new high marks a 48% jump from the April 7 low of just under $75,000, making it the second all-time high for BTC in 2025.
Alongside the price surge, Bitcoin’s market cap hit $2.2 trillion, while its realized cap also reached a new peak at $915 billion, highlighting how much value is flowing into the network.
A sharp uptick in trading activity has driven the rally. CoinGecko data shows 24-hour volume surged to $73.7 billion, compared to $50 billion on Wednesday and $40 billion on Tuesday.
That’s a noticeable jump, especially considering that earlier this month, daily volume had fallen below $30 million, its lowest since February.
BTC’s futures open interest also hit a fresh record of $81.35 billion, up sharply from the $46 billion level seen in early March. That signals growing confidence from institutional and leveraged traders.
Earlier this year, BTC faced strong headwinds as it tumbled more than 30% from January’s high of $109,588, bottoming below $75,000 in early April.
That correction came shortly after President Trump hinted at new tariffs on major U.S. trading partners. But sentiment improved mid-April, especially after the U.S. reached fresh trade agreements with several nations.
Another major factor driving the surge is the continued demand from U.S. spot Bitcoin ETFs, which have seen over $7.4 billion in net inflows over the past five weeks, including $609 million just on Thursday.
This has been backed by Bitcoin’s growing role as a treasury asset, prompting a wave of public companies to load the flagship crypto onto their balance sheets. Strategy, for example, has continued its aggressive accumulation, now holding over 2.7% of all Bitcoin in circulation.
BTC technicals flash bullish patterns
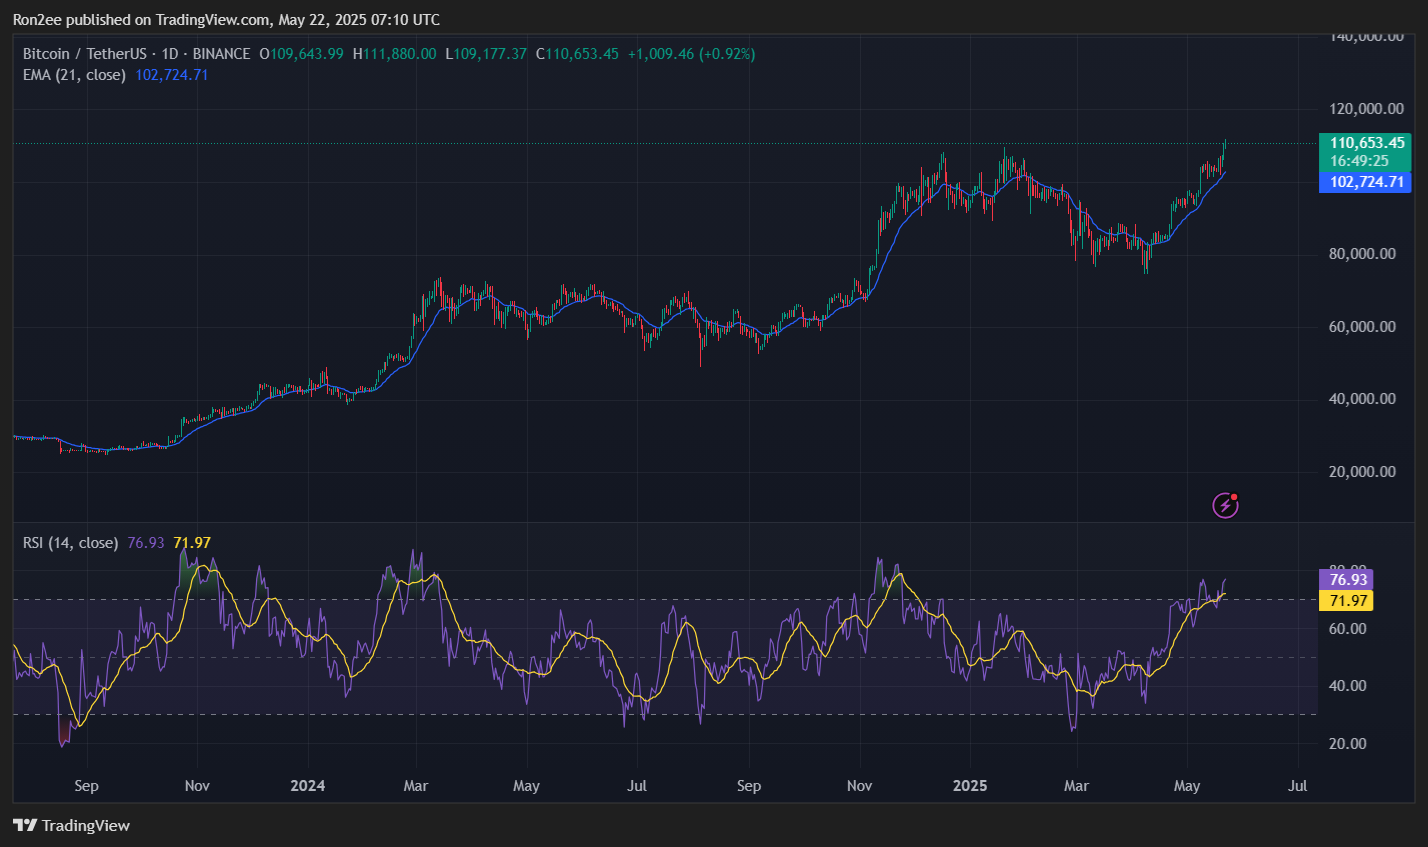
On the 1-day BTC/USDT chart, Bitcoin has flipped the 21-day EMA into support after weeks of acting as resistance. More importantly, the 50-day SMA (blue) just crossed above the 200-day SMA (green), forming the highly watched golden cross pattern. Historically, BTC rallied over 37% in just 3 months following a similar pattern in October 2024.
On the weekly chart, BTC has also broken out of a bull flag pattern, a classic bullish continuation setup where the price consolidates downward after a strong upward move.
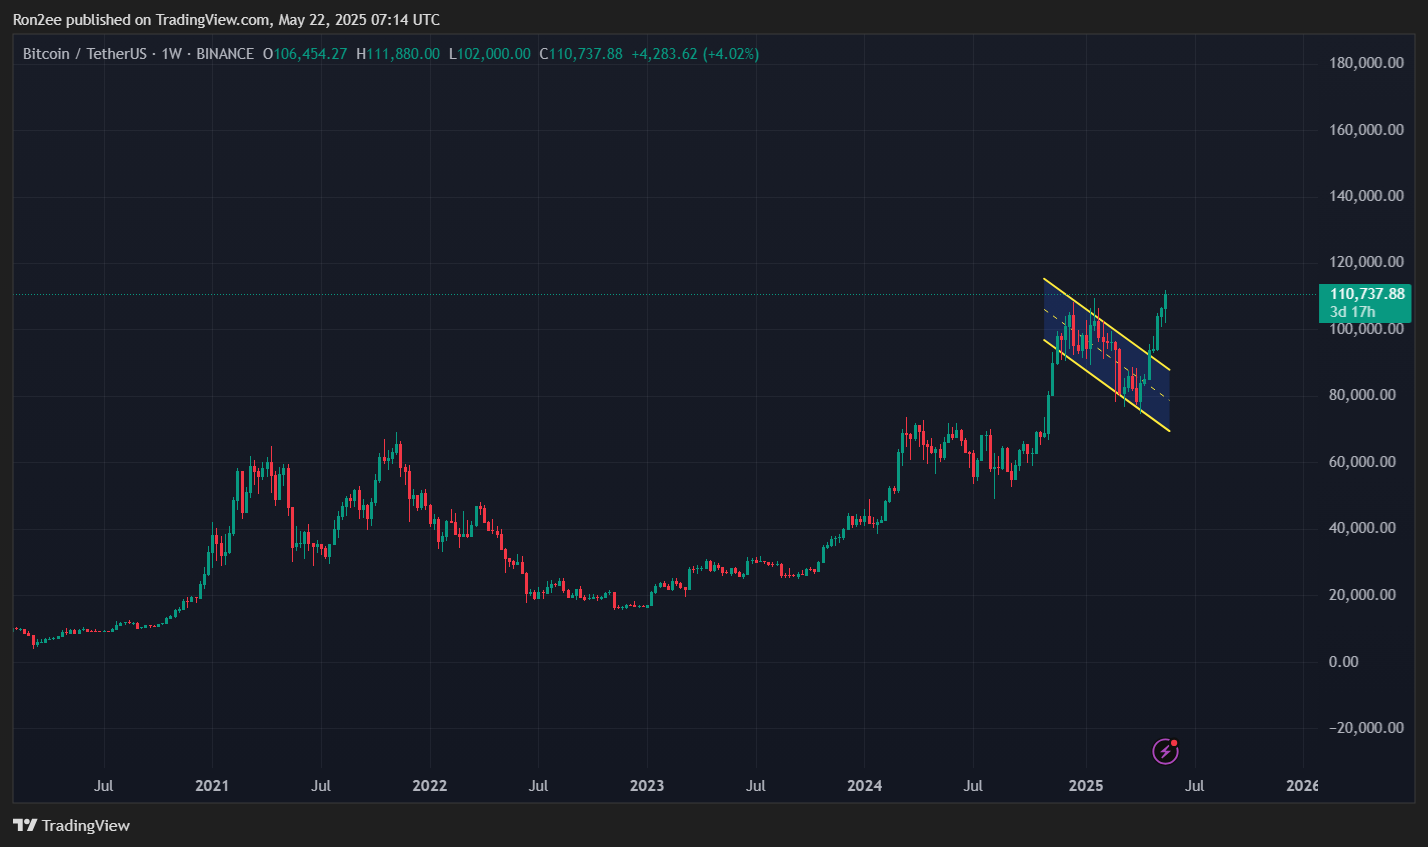
The measured target of this breakout points toward $150,000, matching projections based on the flagpole height added to the breakout zone. If the golden cross plays out fully, the next realistic stop could be around $153,600.
Veteran trader Peter Brandt acknowledged BTC’s new highs but reminded followers that hitting all-time highs is just what bull markets do. In an earlier May 1 X post, he predicted that Bitcoin could reach the bull market cycle top in the $125k to $150K level by Aug-Sep 2025, although he warned of a possible 50% correction afterwards.
Meanwhile, analyst Gert van Lagen is far more bullish, predicting BTC could reach $300K to $320K by the end of the bull cycle. He based his outlook on a breakout from a 4-year Megaphone Pattern, which features widening price swings and often precedes sharp moves upward.
Short-term risks still in play
Despite the overwhelming bullish momentum, a short-term pullback can’t be ruled out. BTC’s RSI and Stochastic Oscillator have both entered overbought territory, indicating the rally may be due for a pause or short-term consolidation.
If that happens, Bitcoin could briefly fall toward its support zone near $93,500, which lines up with its simple moving average supports.
So, while a run toward $150K looks increasingly likely, it may not happen in a straight line. A short-term correction could offer a healthier setup for long-term gains.
Disclosure: This article does not represent investment advice. The content and materials featured on this page are for educational purposes only.