XRP is trading near $1.37 as exchange-flow data shows cooling deposit pressure, while ETF inflows remain positive and traders wait for a breakout.
- XRP trades near $1.37 as Bybit deposit pressure cools after a month-long exchange-flow wave today.
- Binance and Coinbase now show withdrawal-led transactions, suggesting exchange selling pressure may be easing slightly.
- Spot XRP ETFs posted positive daily inflows, but total assets fell from recent levels again.
Ripple’s native token traded near $1.37 on May 20, down about 1.37% over 24 hours, according to crypto.news price data. The token moved between $1.35 and $1.39 during the same period, with 24-hour trading volume above $1.8 billion. XRP held the fifth spot by market cap, valued near $84.6 billion.
Longer-term performance remains weak. XRP was down about 5.88% over seven days and stayed below recent resistance after several failed moves higher. The price action keeps traders focused on the same narrow zone: support near $1.29 to $1.35 and resistance near $1.50.
That range matters because XRP has not yet shown a confirmed trend change. Buyers continue to defend the lower area, but sellers have limited each move toward the upper band. A clean break may now decide whether XRP extends toward $1.80 or returns toward the $1.00 zone.
Recent coverage also showed XRP spot ETFs had drawn strong flows in April, with $17.11 million in net inflows on April 15 and four straight days of positive flows. Combined XRP ETF assets had moved above $1.25 billion at that time, while XRP traded near $1.42.
Bybit deposits cool after month-long wave
According to CryptoQuant analyst Amr Taha, XRP exchange-flow behavior has changed after weeks of strong deposit activity on Bybit. The XRP Multi-Exchange Daily Depositing/Withdrawing Transactions Delta showed Bybit’s transaction delta moving close to zero around May 16.
That marked a clear change from the strong positive readings seen between mid-April and mid-May. In exchange-flow terms, deposit-heavy activity can point to potential selling pressure because tokens moved to exchanges can be sold or traded more easily.
The latest data suggests that Bybit’s earlier deposit imbalance has faded on a transaction-count basis. It does not show the exact XRP volume moving in or out. Still, the change in direction shows that the previous deposit wave has slowed.
Binance and Coinbase have also moved back into negative territory, according to the same CryptoQuant update. That means withdrawal transactions are now higher than deposit transactions on those exchanges. This creates a different setup from the earlier phase, when Bybit-led deposits shaped the market signal.
ETF inflows stay positive despite lower assets
SoSoValue data shows that XRP spot ETFs recorded another positive daily inflow on May 19. Daily total net inflow stood at $1.48 million, while cumulative net inflow remained near $1.39 billion.
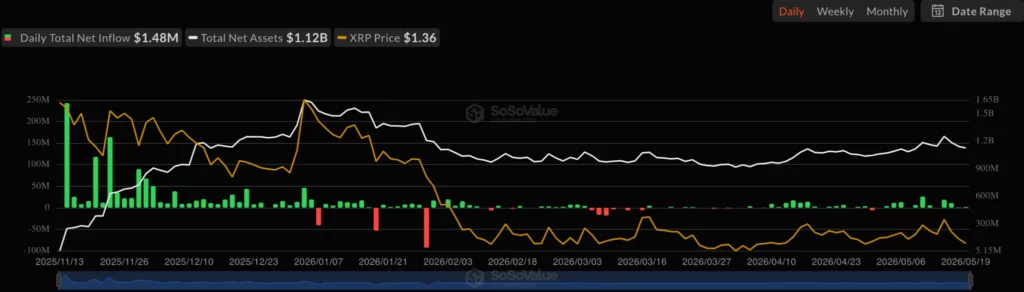
Moreover, XRP spot ETFs recorded $750,440 in inflows on May 18, $10.87 million on May 15, and $18.52 million on May 14. That means daily ETF flows stayed positive across the listed sessions, even as total net assets fell from $1.25 billion on May 14 to $1.12 billion on May 19.
Notably, fresh money continued to enter XRP spot funds, but the total asset base still declined. That can happen when the token price weakens or when market value drops faster than new inflows can offset it.
For XRP traders, the ETF data matters because it shows that institutional demand has not fully disappeared. However, positive ETF inflows alone have not pushed the token above resistance. Price still needs stronger spot demand or a technical breakout to shift the short-term structure.
Traders watch $1.50 and $1.29
Analyst Ali Martinez said XRP is showing the tightest Bollinger Band squeeze on its 3-day chart in more than a year. He described the current range between $1.50 and $1.29 as a “no-trade zone.”
“I’m waiting for a clean 3-day candlestick close outside of this range ($1.50-$1.29) to confirm the next major trend direction,” said Martinez.
He added that a close above $1.50 could target $1.80, while a close below $1.29 could open a move toward $1.00.
EGRAG CRYPTO also warned traders to watch candle behavior inside a key macro zone. He asked whether the current candles show accumulation or hidden distribution, placing focus on structure rather than price alone.
Arab Chain’s CryptoQuant update adds caution. The analyst said XRP institutional accumulation on Binance declined in May, with the indicator moving to about -0.0059 as price fell near $1.38. The reading remains close to neutral, meaning the data does not show heavy distribution.
For now, XRP remains in a tight setup. Exchange deposit pressure has cooled, ETF inflows remain positive, and volatility has compressed. A close above $1.50 would strengthen the bullish case, while a close below $1.29 would weaken the current range.
Disclosure: This article does not represent investment advice. The content and materials featured on this page are for educational purposes only.