
Shiba Inu price has already dropped 30% from its May high, and ongoing whale activity suggests further sell-off may be ahead this month.
Shiba Inu (SHIB) has fallen from its May peak of $0.00001757 to $0.00001260, currently hovering at its lowest level since May 7.
On-chain data reveals that whales have continued offloading their SHIB holdings this month—a sign that larger investors expect more downside.
Santiment data shows that holders with between 100 million and 1 billion tokens hold 17.96 trillion tokens down from 19.5 trillion in the same period last year.
Similarly, holders with between 1 million and 100 million tokens have also been selling aggressively. As a result, the percentage of stablecoin supply held by SHIB whales has dropped to 52.4%, down from this month’s peak of 56%.
Additional data shows many of these investors are capitulating and selling at a loss. The closely-watched network realized profit/loss (NRPL) metric has dropped to negative 1.04 million and has remained in the red for several consecutive days.
Whales may be exiting due to weakening fundamentals. Notably, Shiba Inu’s burn rate has declined significantly in recent weeks, negatively impacting sentiment.
Data from ShibariumScan also shows a sharp drop in on-chain activity. The number of active accounts has declined from 1,045 on June 6 to just 172 today, while transaction fees have fallen from 1,459 BONE on June 4 to 336 BONE on June 8. Falling activity on Shibarium is viewed as bearish, as fewer transactions are being converted into SHIB and burned.
Shiba Inu price technical analysis
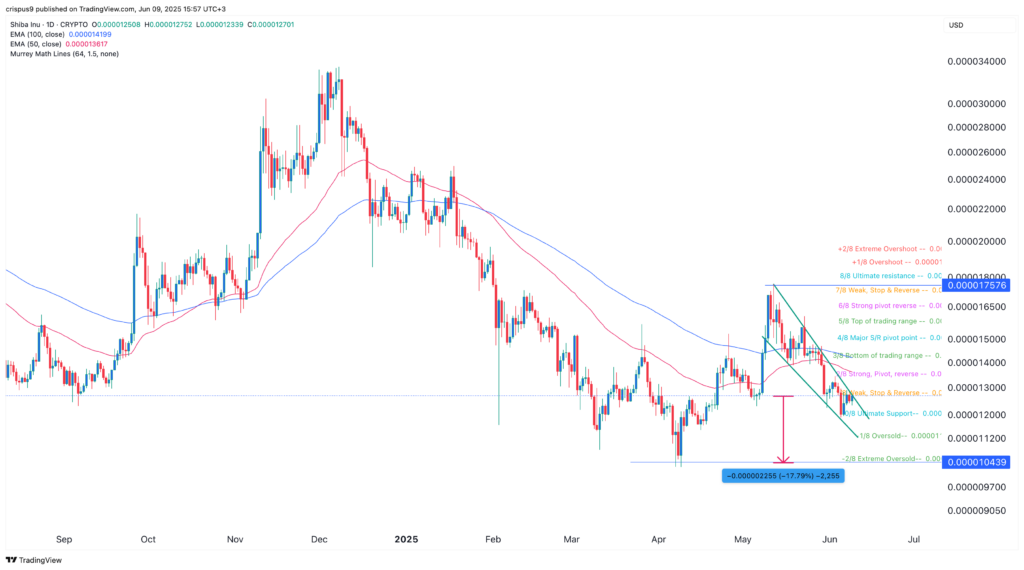
The daily chart shows that SHIB peaked at $0.00001757 on May 12 before plunging to $0.00001250.
Price action has formed a series of lower lows and lower highs, creating a descending channel pattern.
SHIB has also moved below the 50-day and 100-day moving averages, as well as the key pivot and reversal level of the Murrey Math Lines.
The descending channel suggests the potential for further downside, with key support at $0.00001043, its lowest level in April, representing a 17.80% decline from current levels. A move above the 50-day moving average at $0.00001361 would invalidate the bearish outlook.