
Uniswap price risks a drop to $3.3 in the coming sessions if it confirms a break below a key trendline support on charts.
- Uniswap price fell to $3.85 after repeated rejection at $4.20, with a potential drop to $3.30 if key trendline support breaks.
- Network activity weakened, with TVL falling to $3.31 billion and weekly fees dropping sharply, signaling reduced usage.
- Bearish momentum builds as futures open interest declines and indicators turn negative, while a rebound above $4.10 could revive bullish structure.
According to data from crypto.news, Uniswap (UNI) price fell 3.8% on Wednesday, March 18, to $3.85 at the time of writing. The token fell after a series of failed attempts by bulls to break past $4.20, a resistance level that held firm at least three times this week.
Beyond the price action, Uniswap has been struggling with a significant slump in network activity. Data from DeFiLlama shows that the total value locked on the platform has plummeted to $3.31 billion, which is significantly below the $6.3 billion record set in August last year.
At the same time, the weekly fees generated by the DeFi protocol on the network have shrunk to nearly one-fourth of the levels recorded in October.
Demand in its futures market has also dropped, leading to a visible cooling of investor sentiment. According to data from CoinGlass, the open interest in Uniswap futures has dropped 5.8% over the past 24 hours.
The altcoin also tanked as investors turned cautious ahead of the Federal Reserve rate decision scheduled for later today. At press time, the broader crypto market had dropped 1.8% to $2.56 trillion, while Bitcoin (BTC), Ethereum (ETH), and other major coins also printed red.
Uniswap price analysis
On the daily chart, the Uniswap price is on the cusp of breaking below an ascending trendline that has been acting as a dynamic support for the token since early February this year.
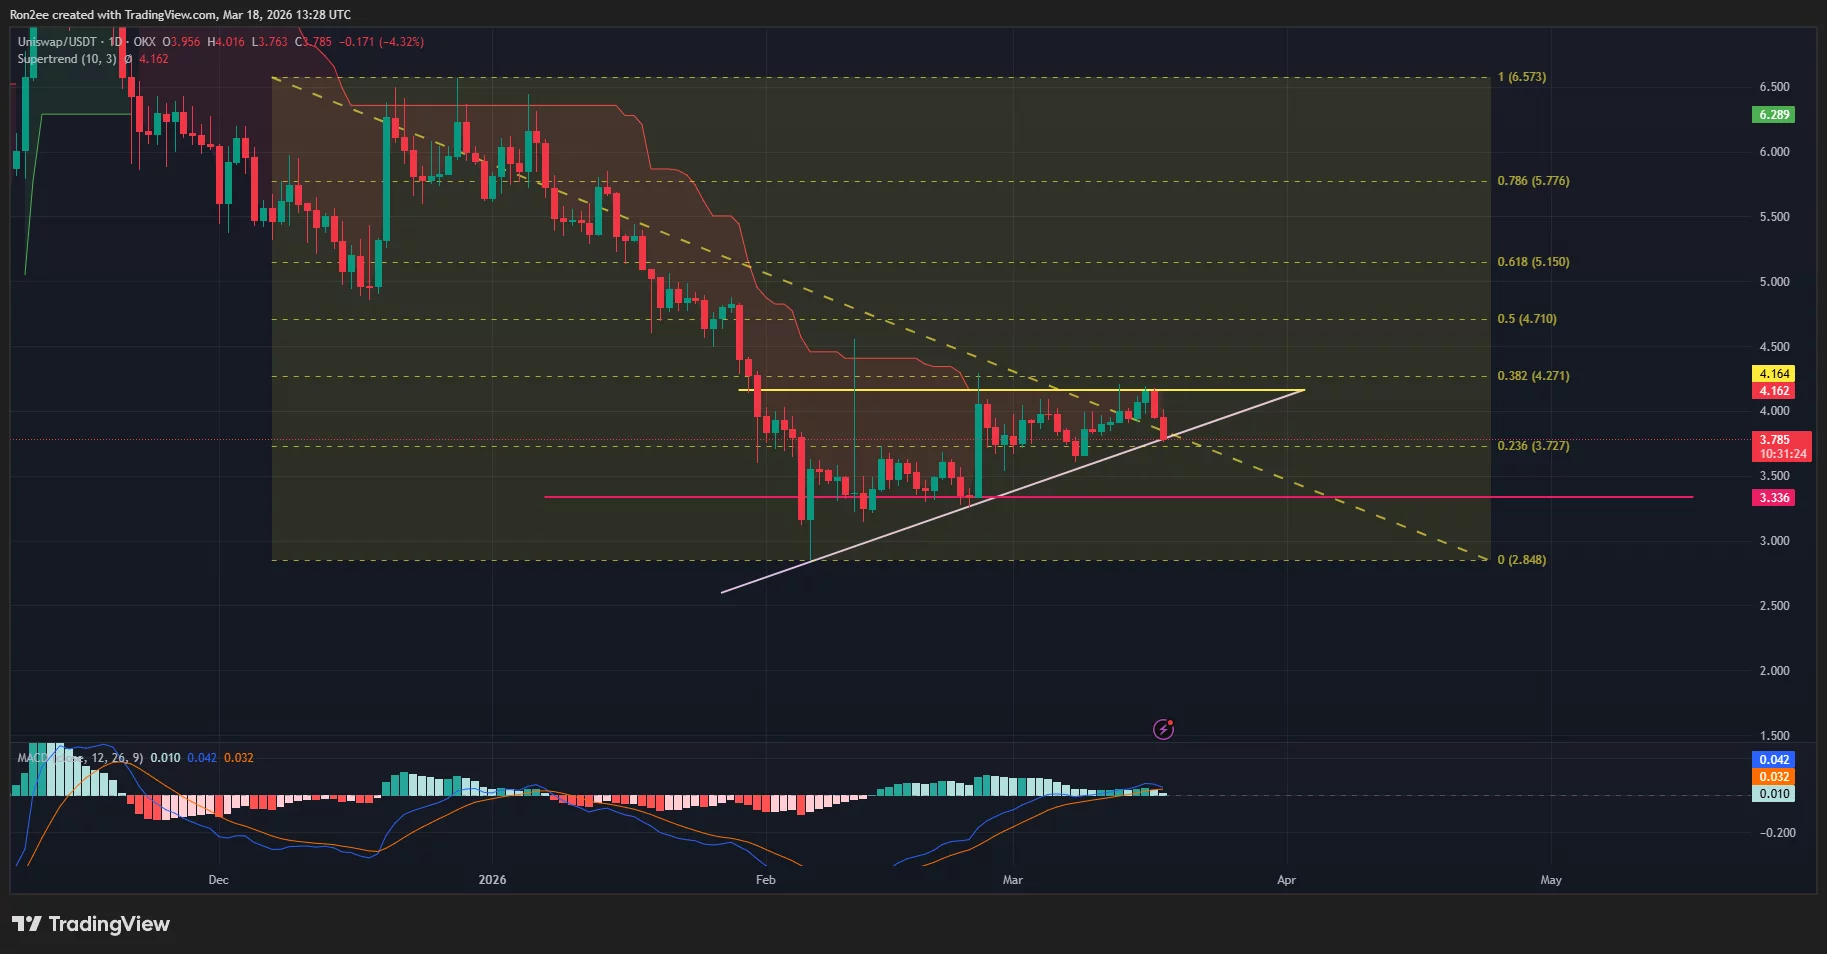
A break below this trendline support could lead bears to push for lower prices, potentially triggering a drop to the $3.3 support area where bulls previously managed to stage a recovery.
Technical indicators seem to support such a bearish outlook as they show bears gaining momentum. Notably, the Supertrend indicator has flashed red while the MACD lines are moving closer toward a bearish crossover, suggesting that the path of least resistance is currently to the downside.
However, a more nuanced outlook comes from the fact that the ascending trendline forms a part of an ascending triangle pattern on the chart with a horizontal resistance at $4.1. If Uniswap price manages to rebound above this level, it could confirm the bullish pattern and potentially end the current correction by sparking a fresh rally toward previous highs.
Disclosure: This article does not represent investment advice. The content and materials featured on this page are for educational purposes only.