- After falling from recent highs above $250, SOL is currently trading around $234.
- Bullish attitude is reinforced by institutional accumulation (~$1.65B via Forward Industries & Galaxy Digital).
- Although it increases volatility, meme coin speculation fuels high trading volume and network utilization.
- Positive outlook: A break above $250 would cause SOL to go closer to $270–$300, with longer-term prospects above $400.
- Downside risk: If $230–$232 is not held, SOL might drop to $213 and then to $200–$185.
- The general view for Solana price prediction is cautiously favorable, but the present excitement makes short-term corrections more likely.
With substantial institutional accumulation supporting a recent surge, Solana is currently trading in the $230–$240 region. The bullish Solana price prediction narrative was strengthened when Forward Industries, with the help of Galaxy Digital and others, recently raised a sizeable sum (~$1.65B) to develop a treasury strategy based on Solana.
This adds weight to the current Solana price prediction, which balances institutional confidence against speculative risks.
Simultaneously, Solana has seen a surge in both retail and speculative meme-coin activity, which has led to higher trade volume and increased network usage. The question of whether SOL is preparing for more upside or if the current enthusiasm could lead to a reversal is raised by these two forces: speculation and institutional support.
Table of Contents
Solana price prediction: What we know
After encountering resistance close to $250, Solana (SOL) has cooled from its recent highs, falling to about $234. With the $230–227 range seen as a crucial demand territory, the price is maintaining above the immediate support zone, which is located between $231 and $232.
Meanwhile, there is some downward pressure due to the apparent profit-taking by long-term holders and the delays in authorization for spot Solana ETFs.
Bulls may be cautious at current levels, according to on-chain indicators that show significant activity and increasing network utilization. However, momentum measurements (RSI, MACD) are exhibiting signals of calmness.
Upside for Solana price
SOL may be able to reach $270–$300 if it can hold onto support around $231–$232 and overcome opposition around $250. On the weekly chart, the SuperTrend indicator has turned bullish; historically, when paired with robust demand, this indicator has preceded significant increases in SOL.
As demonstrated by Forward Industries and others, institutional accumulation is still a significant tailwind that supports trader confidence. This makes the short-term SOL price forecast lean toward cautious optimism, as traders weigh speculative activity against stronger structural support.
Downside for SOL price
In the event of a more severe correction, failure to maintain the $230–$232 support region might lead to falls toward $213 and, in a more dire scenario, further declines to $200–$185. Long-term holders’ selling pressure has increased to six-month highs, suggesting that major owners’ conviction is eroding.
The short-term gain from institutional demand is diminished by the ongoing uncertainty caused by the delay in ETF approvals. Profit-taking may result from overbought readings, particularly in short timeframes, and the hard resistance near $250.
Solana price prediction based on current levels
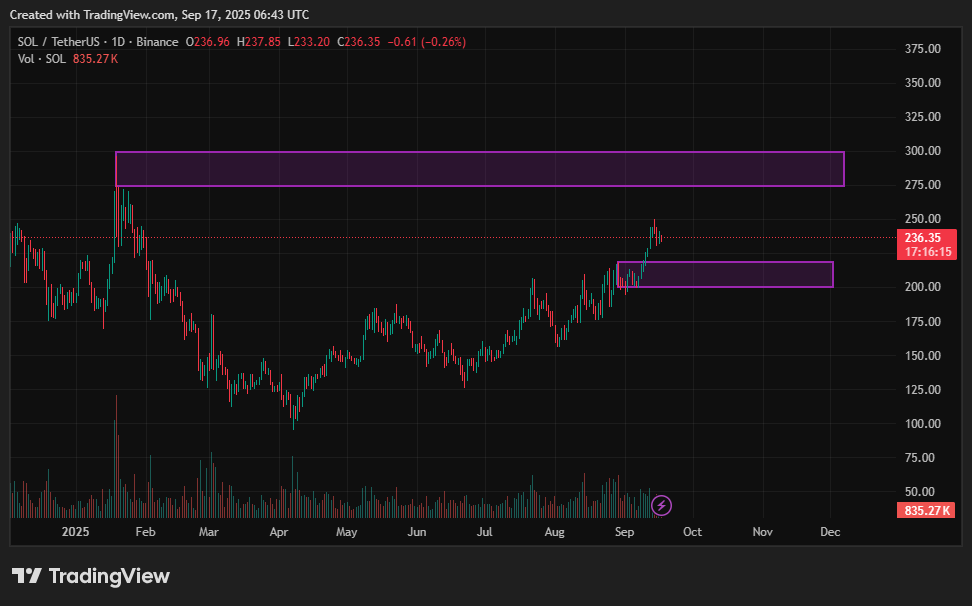
Watch out for the $230–$250 key zones. Targets in the $270–$300 range are likely if SOL breaks above $250 with significant conviction. According to certain long-term projections, greater zones ($400 or more) are possible if that momentum holds and larger macro/institutional tailwinds continue to be advantageous.
If, on the other hand, negative factors (such as profit-taking or regulatory headwinds) take precedence, a decline below $230 might result in a decline near $213 and, worse, toward $200 to $185.
Overall, the Solana outlook remains cautiously bullish: there is room for growth, but with the current speculative heat, there is also a strong expectation of potential overextension and correction in the short term.
Disclosure: This article does not represent investment advice. The content and materials featured on this page are for educational purposes only.