
Mantle price has hit a new all-time high, driven by recent developments that have expanded its market presence. Will the ongoing rally continue, or is the momentum fading?
- MNT price hit a new all-time high of $1.68 on Friday, Sep. 12.
- Bybit’s promotional campaign surrounding MNT led the token’s gains this week.
- A double bottom formed on the weekly chart hints at 40% potential upside at play.
According to data from crypto.news, Mantle (MNT) shot up to an all-time high of $1.68 on Sep. 12, morning Asian time, before settling a little lower at $1.61 at press time. At this price, it is up 35.5% over the past 7 days and 55% over the last month. It also extends the token’s gains from its year-to-date lows to over 130%
The token’s rally coincided with its futures open interest also hitting a new peak at $211.8 million today, significantly higher than the $61.95 million seen around the same day last month. When increases in open interest align with rising asset prices, it means more traders are opening bullish positions, which could support further upside for the token.
Mantle’s surge this week was driven by recent promotional campaigns surrounding MNT on the Bybit exchange as part of Bybit’s “MNT × Bybit 2.0” roadmap. The platform has offered fee discounts (on both spot and derivatives) and VIP-tier benefits to users holding MNT while trading. Such incentives could have driven greater demand for the token.
Additionally, part of the revenue from Bybit (e.g., exchange fees) or Mantle’s treasury may be used to buy back MNT tokens and burn them, effectively removing them from circulation. When such reduction in supply occurs, it tends to create deflationary pressure on the token, which could support price appreciation.
Mantle’s gains have also been supported by Bybit’s announcement that it will list 21 new spot trading pairs involving MNT, a move that will increase liquidity and give users more ways to trade, hedge, or arbitrage across more pairings in Mantle’s ecosystem.
Mantle price analysis
On the weekly chart, MNT price is close to confirming a multi-month double bottom pattern, which began to take shape at the start of April this year.
A double bottom is a bullish reversal pattern that forms when an asset tests a support level twice with a moderate high between the lows. For MNT, the two bottoms lie near $0.52, while the neckline is positioned at $1.39.
MNT has already broken out above the neckline, and a successful retest of the $1.39 level as support would confirm the breakout and validate the pattern.
Another potential bull sign was that the 20-day simple moving average is poised to cross above the 50-day moving average. If confirmed, this would form a golden cross, a bullish signal that is often followed by multi-week rallies.
A look at the MACD indicator also shows the MACD lines have been trending upwards, accompanied by growing green histograms, which is another confirmation that bulls are the dominant force at the moment.
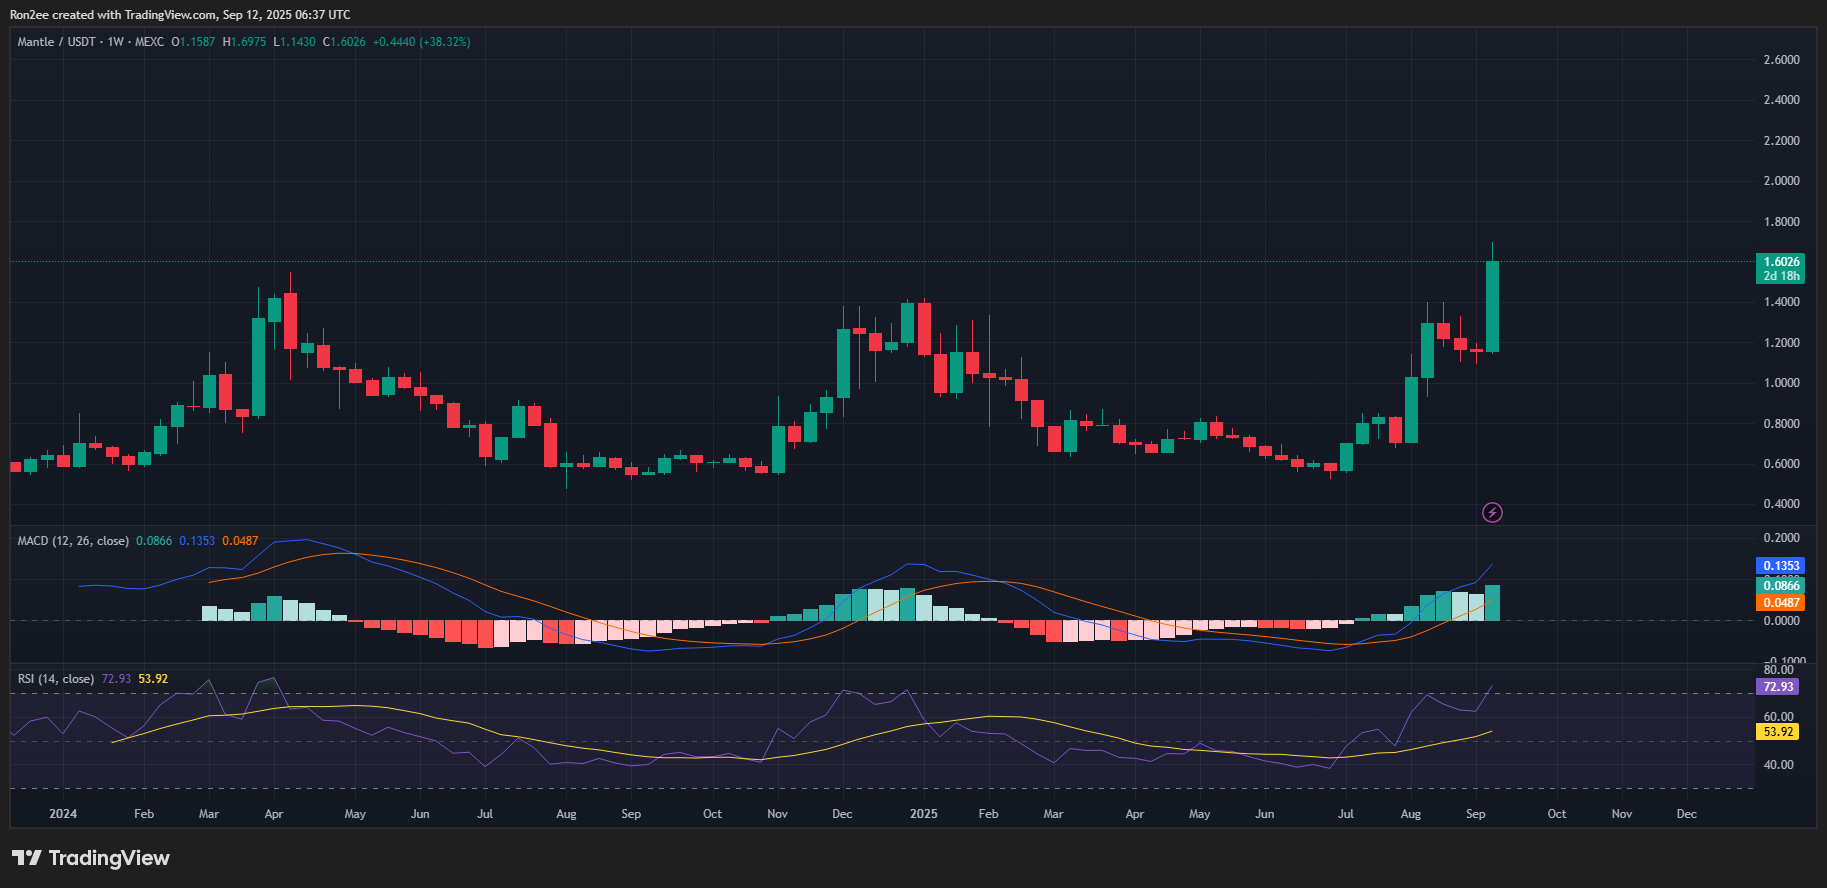
However, MNT’s Relative Strength Index has crossed into overbought territory. While this is a telltale sign that the rally could face short-term selling pressure, it does not necessarily indicate a trend reversal.
In many cases, RSI remains in the overbought area for an extended period, especially during times of strong momentum when buyers continue to dominate and push prices higher despite overheated technical readings.
Given this confluence of bullish technical signals, the next likely target for MNT lies at $2.28, 40% above the current price level. This is calculated by measuring the depth of the double bottom formation and adding it to the breakout point at $1.39.
However, a drop below the $1.39 neckline would invalidate the setup and could open the door for a reversal if sellers begin to regain control.
Disclosure: This article does not represent investment advice. The content and materials featured on this page are for educational purposes only.